Immigrants from Afghanistan vs Immigrants from South Africa Births to Unmarried Women
COMPARE
Immigrants from Afghanistan
Immigrants from South Africa
Births to Unmarried Women
Births to Unmarried Women Comparison
Immigrants from Afghanistan
Immigrants from South Africa
28.7%
BIRTHS TO UNMARRIED WOMEN
98.1/ 100
METRIC RATING
80th/ 347
METRIC RANK
29.3%
BIRTHS TO UNMARRIED WOMEN
95.7/ 100
METRIC RATING
97th/ 347
METRIC RANK
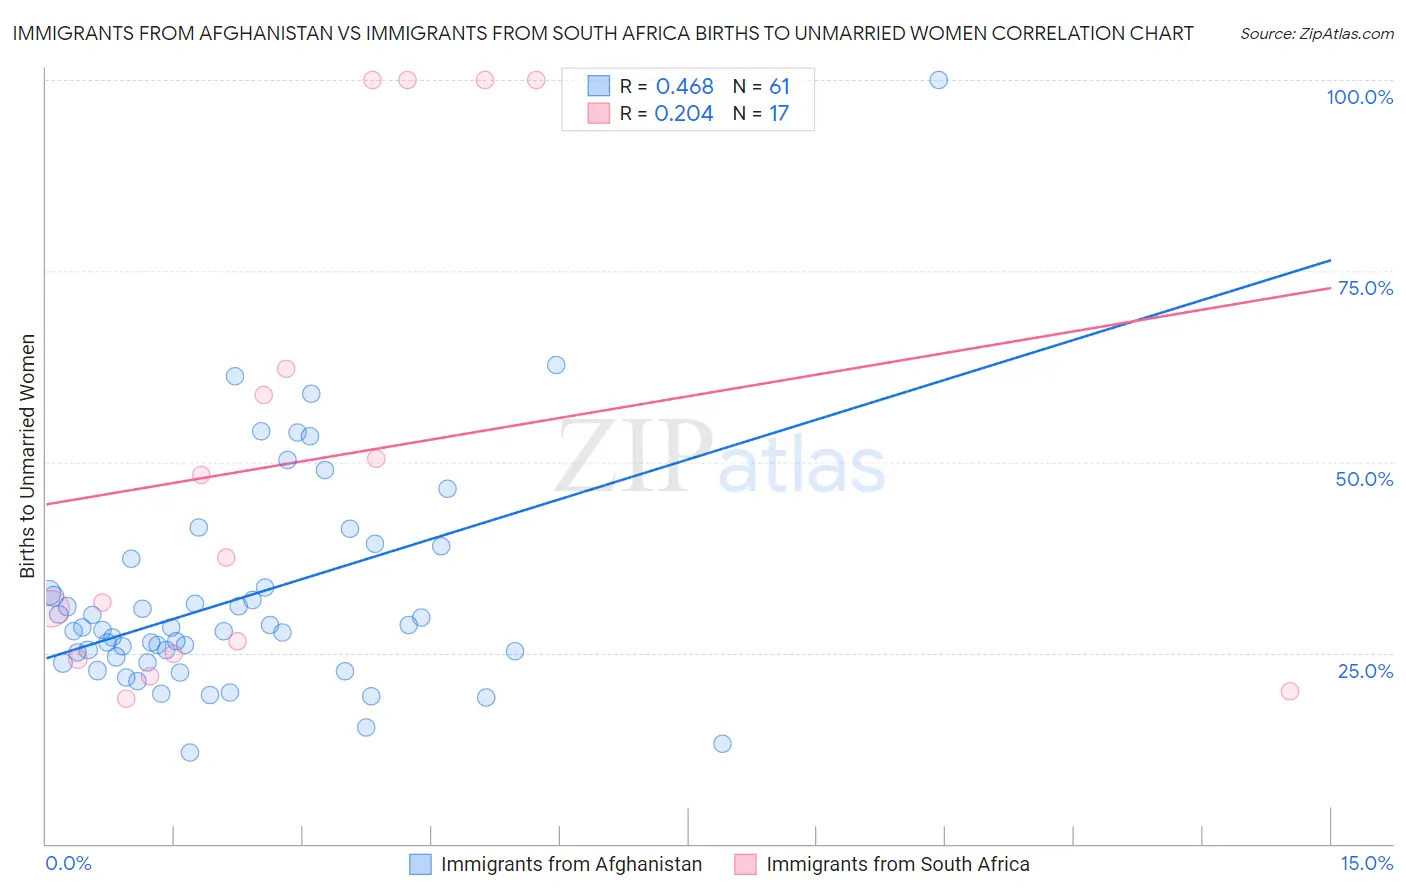
Immigrants from Afghanistan vs Immigrants from South Africa Births to Unmarried Women Correlation Chart
The statistical analysis conducted on geographies consisting of 143,617,588 people shows a moderate positive correlation between the proportion of Immigrants from Afghanistan and percentage of births to unmarried women in the United States with a correlation coefficient (R) of 0.468 and weighted average of 28.7%. Similarly, the statistical analysis conducted on geographies consisting of 219,322,992 people shows a weak positive correlation between the proportion of Immigrants from South Africa and percentage of births to unmarried women in the United States with a correlation coefficient (R) of 0.204 and weighted average of 29.3%, a difference of 2.3%.
Births to Unmarried Women Correlation Summary
| Measurement | Immigrants from Afghanistan | Immigrants from South Africa |
| Minimum | 11.9% | 19.0% |
| Maximum | 100.0% | 100.0% |
| Range | 88.1% | 81.0% |
| Mean | 32.2% | 50.4% |
| Median | 28.0% | 37.5% |
| Interquartile 25% (IQ1) | 24.1% | 24.5% |
| Interquartile 75% (IQ3) | 35.4% | 81.1% |
| Interquartile Range (IQR) | 11.4% | 56.6% |
| Standard Deviation (Sample) | 14.6% | 31.2% |
| Standard Deviation (Population) | 14.5% | 30.3% |
Demographics Similar to Immigrants from Afghanistan and Immigrants from South Africa by Births to Unmarried Women
In terms of births to unmarried women, the demographic groups most similar to Immigrants from Afghanistan are Danish (28.7%, a difference of 0.020%), Immigrants from Austria (28.7%, a difference of 0.040%), Zimbabwean (28.7%, a difference of 0.050%), Romanian (28.7%, a difference of 0.15%), and Immigrants from Kuwait (28.8%, a difference of 0.23%). Similarly, the demographic groups most similar to Immigrants from South Africa are Immigrants from Syria (29.4%, a difference of 0.020%), Norwegian (29.3%, a difference of 0.040%), Immigrants from Vietnam (29.3%, a difference of 0.27%), Ukrainian (29.2%, a difference of 0.41%), and Estonian (29.2%, a difference of 0.53%).
| Demographics | Rating | Rank | Births to Unmarried Women |
| Zimbabweans | 98.2 /100 | #78 | Exceptional 28.7% |
| Danes | 98.2 /100 | #79 | Exceptional 28.7% |
| Immigrants | Afghanistan | 98.1 /100 | #80 | Exceptional 28.7% |
| Immigrants | Austria | 98.1 /100 | #81 | Exceptional 28.7% |
| Romanians | 98.0 /100 | #82 | Exceptional 28.7% |
| Immigrants | Kuwait | 98.0 /100 | #83 | Exceptional 28.8% |
| Immigrants | Poland | 97.6 /100 | #84 | Exceptional 28.9% |
| Sri Lankans | 97.5 /100 | #85 | Exceptional 28.9% |
| Immigrants | Jordan | 97.4 /100 | #86 | Exceptional 29.0% |
| Taiwanese | 97.3 /100 | #87 | Exceptional 29.0% |
| Immigrants | France | 97.3 /100 | #88 | Exceptional 29.0% |
| Immigrants | Saudi Arabia | 97.0 /100 | #89 | Exceptional 29.1% |
| Immigrants | Latvia | 96.8 /100 | #90 | Exceptional 29.1% |
| Immigrants | Fiji | 96.6 /100 | #91 | Exceptional 29.2% |
| Arabs | 96.5 /100 | #92 | Exceptional 29.2% |
| Estonians | 96.5 /100 | #93 | Exceptional 29.2% |
| Ukrainians | 96.3 /100 | #94 | Exceptional 29.2% |
| Immigrants | Vietnam | 96.1 /100 | #95 | Exceptional 29.3% |
| Norwegians | 95.8 /100 | #96 | Exceptional 29.3% |
| Immigrants | South Africa | 95.7 /100 | #97 | Exceptional 29.3% |
| Immigrants | Syria | 95.7 /100 | #98 | Exceptional 29.4% |