Syrian vs Immigrants from Jordan Divorced or Separated
COMPARE
Syrian
Immigrants from Jordan
Divorced or Separated
Divorced or Separated Comparison
Syrians
Immigrants from Jordan
11.7%
DIVORCED OR SEPARATED
95.1/ 100
METRIC RATING
119th/ 347
METRIC RANK
11.6%
DIVORCED OR SEPARATED
98.6/ 100
METRIC RATING
98th/ 347
METRIC RANK
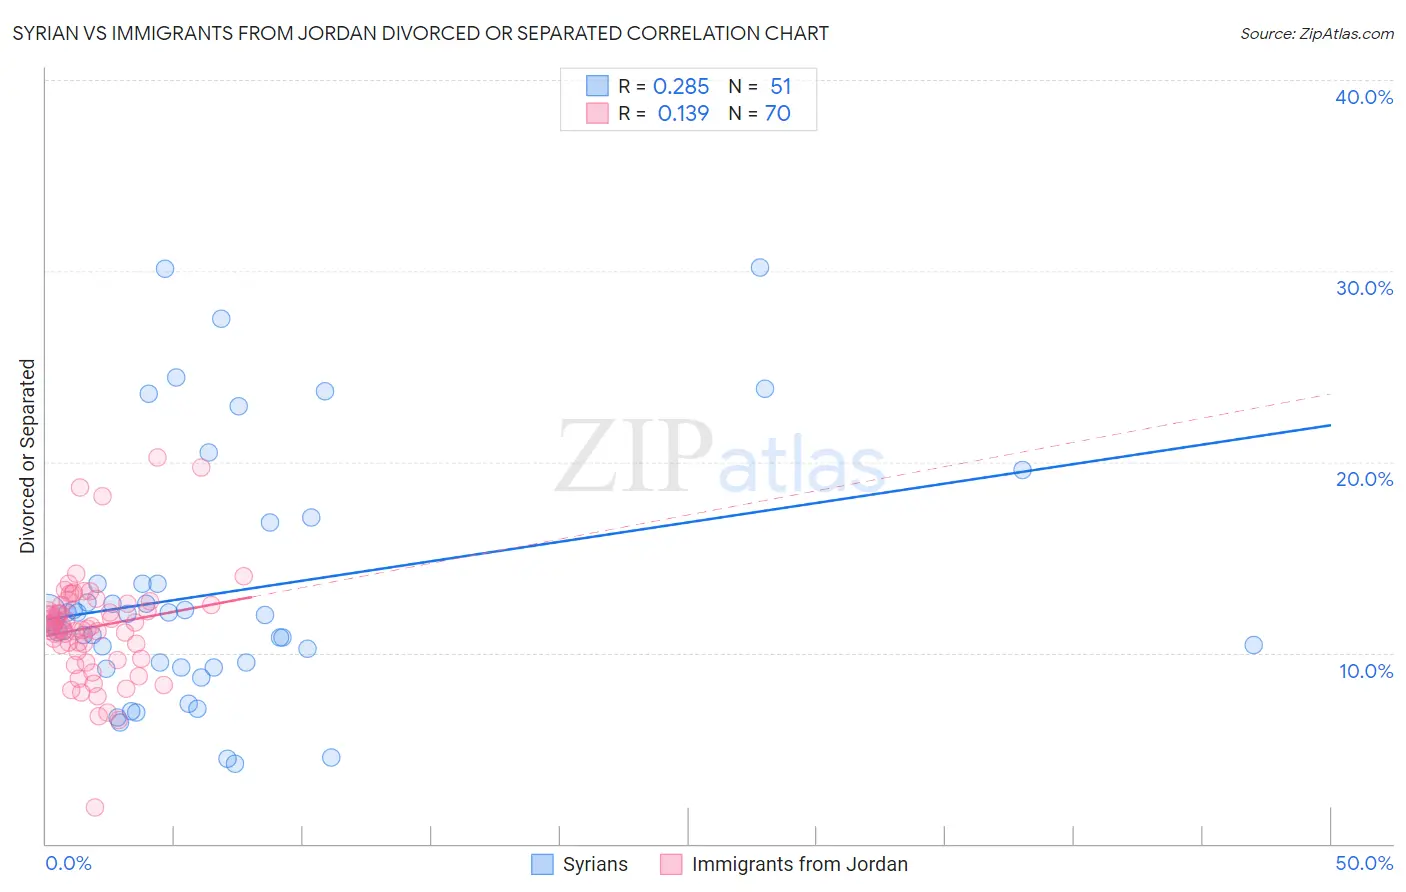
Syrian vs Immigrants from Jordan Divorced or Separated Correlation Chart
The statistical analysis conducted on geographies consisting of 266,220,944 people shows a weak positive correlation between the proportion of Syrians and percentage of population currently divorced or separated in the United States with a correlation coefficient (R) of 0.285 and weighted average of 11.7%. Similarly, the statistical analysis conducted on geographies consisting of 181,255,451 people shows a poor positive correlation between the proportion of Immigrants from Jordan and percentage of population currently divorced or separated in the United States with a correlation coefficient (R) of 0.139 and weighted average of 11.6%, a difference of 1.2%.
Divorced or Separated Correlation Summary
| Measurement | Syrian | Immigrants from Jordan |
| Minimum | 4.2% | 1.9% |
| Maximum | 30.2% | 20.2% |
| Range | 26.0% | 18.3% |
| Mean | 13.2% | 11.3% |
| Median | 12.0% | 11.4% |
| Interquartile 25% (IQ1) | 9.3% | 10.1% |
| Interquartile 75% (IQ3) | 13.6% | 12.5% |
| Interquartile Range (IQR) | 4.4% | 2.4% |
| Standard Deviation (Sample) | 6.5% | 2.9% |
| Standard Deviation (Population) | 6.4% | 2.8% |
Similar Demographics by Divorced or Separated
Demographics Similar to Syrians by Divorced or Separated
In terms of divorced or separated, the demographic groups most similar to Syrians are Ecuadorian (11.7%, a difference of 0.040%), Immigrants from Uganda (11.7%, a difference of 0.050%), Immigrants from Iraq (11.7%, a difference of 0.060%), Iraqi (11.8%, a difference of 0.090%), and Romanian (11.8%, a difference of 0.10%).
| Demographics | Rating | Rank | Divorced or Separated |
| Immigrants | France | 96.6 /100 | #112 | Exceptional 11.7% |
| Estonians | 96.6 /100 | #113 | Exceptional 11.7% |
| Immigrants | Norway | 95.9 /100 | #114 | Exceptional 11.7% |
| Lithuanians | 95.7 /100 | #115 | Exceptional 11.7% |
| Immigrants | Iraq | 95.4 /100 | #116 | Exceptional 11.7% |
| Immigrants | Uganda | 95.3 /100 | #117 | Exceptional 11.7% |
| Ecuadorians | 95.3 /100 | #118 | Exceptional 11.7% |
| Syrians | 95.1 /100 | #119 | Exceptional 11.7% |
| Iraqis | 94.6 /100 | #120 | Exceptional 11.8% |
| Romanians | 94.5 /100 | #121 | Exceptional 11.8% |
| Menominee | 93.8 /100 | #122 | Exceptional 11.8% |
| Immigrants | Immigrants | 93.7 /100 | #123 | Exceptional 11.8% |
| Ugandans | 93.1 /100 | #124 | Exceptional 11.8% |
| Ukrainians | 92.3 /100 | #125 | Exceptional 11.8% |
| South American Indians | 92.1 /100 | #126 | Exceptional 11.8% |
Demographics Similar to Immigrants from Jordan by Divorced or Separated
In terms of divorced or separated, the demographic groups most similar to Immigrants from Jordan are Immigrants from Sweden (11.6%, a difference of 0.020%), Latvian (11.6%, a difference of 0.040%), Immigrants from Northern Europe (11.6%, a difference of 0.050%), Immigrants from Ukraine (11.6%, a difference of 0.060%), and Immigrants from Guyana (11.6%, a difference of 0.080%).
| Demographics | Rating | Rank | Divorced or Separated |
| Spanish American Indians | 99.0 /100 | #91 | Exceptional 11.6% |
| Immigrants | Denmark | 98.9 /100 | #92 | Exceptional 11.6% |
| Arabs | 98.9 /100 | #93 | Exceptional 11.6% |
| Immigrants | Fiji | 98.9 /100 | #94 | Exceptional 11.6% |
| Immigrants | Serbia | 98.8 /100 | #95 | Exceptional 11.6% |
| Immigrants | Ukraine | 98.7 /100 | #96 | Exceptional 11.6% |
| Latvians | 98.7 /100 | #97 | Exceptional 11.6% |
| Immigrants | Jordan | 98.6 /100 | #98 | Exceptional 11.6% |
| Immigrants | Sweden | 98.6 /100 | #99 | Exceptional 11.6% |
| Immigrants | Northern Europe | 98.6 /100 | #100 | Exceptional 11.6% |
| Immigrants | Guyana | 98.5 /100 | #101 | Exceptional 11.6% |
| Immigrants | Croatia | 98.3 /100 | #102 | Exceptional 11.6% |
| Maltese | 98.2 /100 | #103 | Exceptional 11.6% |
| Salvadorans | 98.2 /100 | #104 | Exceptional 11.6% |
| Immigrants | El Salvador | 97.9 /100 | #105 | Exceptional 11.7% |