Swedish vs Immigrants from Jordan Divorced or Separated
COMPARE
Swedish
Immigrants from Jordan
Divorced or Separated
Divorced or Separated Comparison
Swedes
Immigrants from Jordan
12.1%
DIVORCED OR SEPARATED
34.4/ 100
METRIC RATING
191st/ 347
METRIC RANK
11.6%
DIVORCED OR SEPARATED
98.6/ 100
METRIC RATING
98th/ 347
METRIC RANK
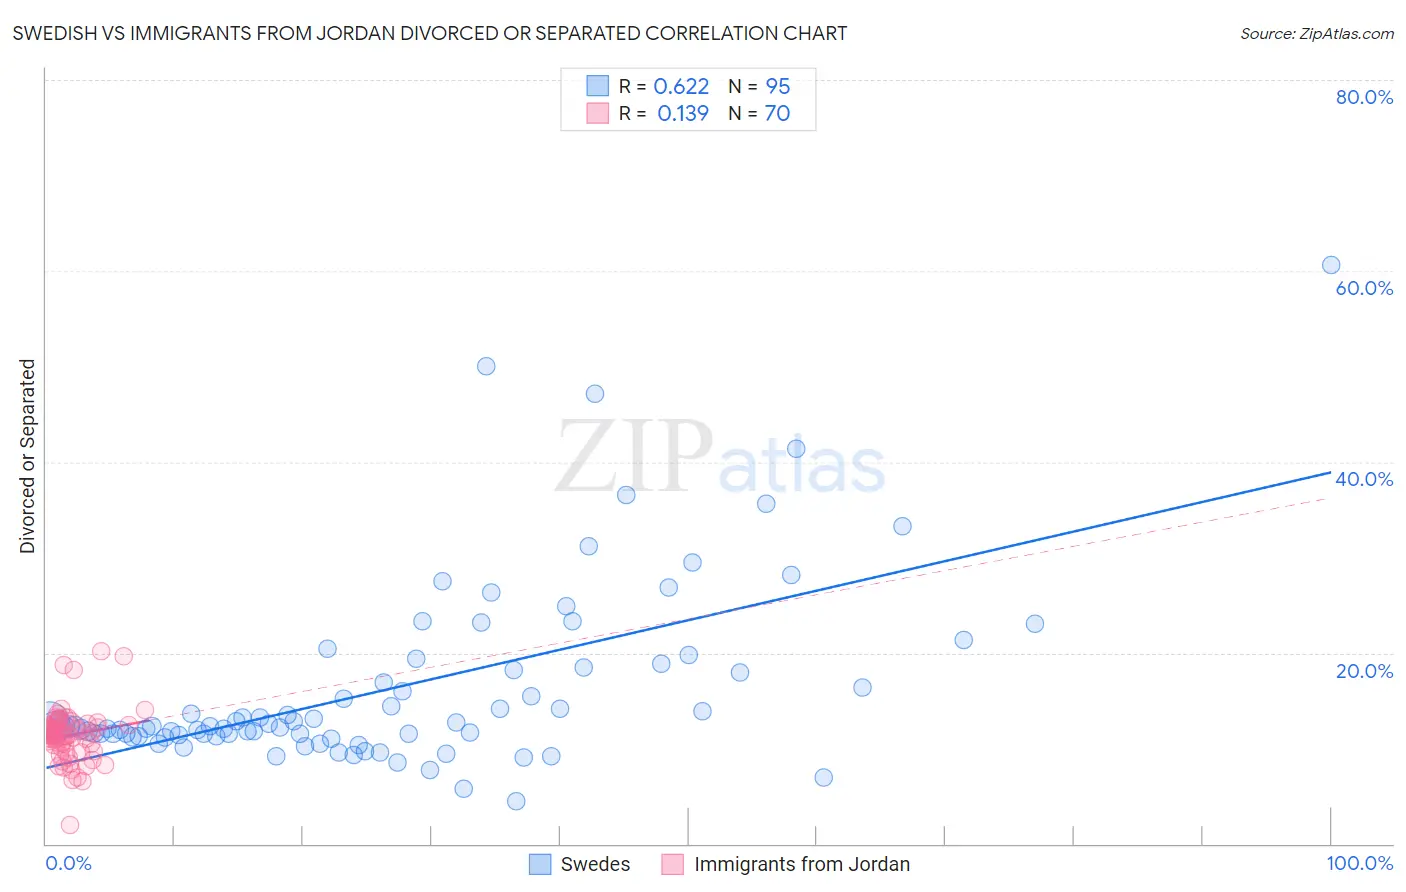
Swedish vs Immigrants from Jordan Divorced or Separated Correlation Chart
The statistical analysis conducted on geographies consisting of 538,888,854 people shows a significant positive correlation between the proportion of Swedes and percentage of population currently divorced or separated in the United States with a correlation coefficient (R) of 0.622 and weighted average of 12.1%. Similarly, the statistical analysis conducted on geographies consisting of 181,255,451 people shows a poor positive correlation between the proportion of Immigrants from Jordan and percentage of population currently divorced or separated in the United States with a correlation coefficient (R) of 0.139 and weighted average of 11.6%, a difference of 4.4%.
Divorced or Separated Correlation Summary
| Measurement | Swedish | Immigrants from Jordan |
| Minimum | 4.5% | 1.9% |
| Maximum | 60.6% | 20.2% |
| Range | 56.1% | 18.3% |
| Mean | 16.3% | 11.3% |
| Median | 12.3% | 11.4% |
| Interquartile 25% (IQ1) | 11.4% | 10.1% |
| Interquartile 75% (IQ3) | 18.5% | 12.5% |
| Interquartile Range (IQR) | 7.2% | 2.4% |
| Standard Deviation (Sample) | 9.7% | 2.9% |
| Standard Deviation (Population) | 9.6% | 2.8% |
Similar Demographics by Divorced or Separated
Demographics Similar to Swedes by Divorced or Separated
In terms of divorced or separated, the demographic groups most similar to Swedes are Moroccan (12.1%, a difference of 0.020%), Sierra Leonean (12.1%, a difference of 0.040%), Norwegian (12.1%, a difference of 0.050%), Immigrants from Thailand (12.1%, a difference of 0.070%), and Immigrants from Eritrea (12.1%, a difference of 0.10%).
| Demographics | Rating | Rank | Divorced or Separated |
| Immigrants | North America | 41.1 /100 | #184 | Average 12.1% |
| Immigrants | Nigeria | 40.5 /100 | #185 | Average 12.1% |
| Immigrants | Chile | 39.0 /100 | #186 | Fair 12.1% |
| Belizeans | 37.7 /100 | #187 | Fair 12.1% |
| Immigrants | Belize | 37.6 /100 | #188 | Fair 12.1% |
| Sierra Leoneans | 35.5 /100 | #189 | Fair 12.1% |
| Moroccans | 34.8 /100 | #190 | Fair 12.1% |
| Swedes | 34.4 /100 | #191 | Fair 12.1% |
| Norwegians | 33.2 /100 | #192 | Fair 12.1% |
| Immigrants | Thailand | 32.5 /100 | #193 | Fair 12.1% |
| Immigrants | Eritrea | 31.9 /100 | #194 | Fair 12.1% |
| Immigrants | England | 31.4 /100 | #195 | Fair 12.1% |
| Immigrants | Burma/Myanmar | 30.4 /100 | #196 | Fair 12.1% |
| Immigrants | Africa | 30.3 /100 | #197 | Fair 12.1% |
| Nigerians | 30.1 /100 | #198 | Fair 12.1% |
Demographics Similar to Immigrants from Jordan by Divorced or Separated
In terms of divorced or separated, the demographic groups most similar to Immigrants from Jordan are Immigrants from Sweden (11.6%, a difference of 0.020%), Latvian (11.6%, a difference of 0.040%), Immigrants from Northern Europe (11.6%, a difference of 0.050%), Immigrants from Ukraine (11.6%, a difference of 0.060%), and Immigrants from Guyana (11.6%, a difference of 0.080%).
| Demographics | Rating | Rank | Divorced or Separated |
| Spanish American Indians | 99.0 /100 | #91 | Exceptional 11.6% |
| Immigrants | Denmark | 98.9 /100 | #92 | Exceptional 11.6% |
| Arabs | 98.9 /100 | #93 | Exceptional 11.6% |
| Immigrants | Fiji | 98.9 /100 | #94 | Exceptional 11.6% |
| Immigrants | Serbia | 98.8 /100 | #95 | Exceptional 11.6% |
| Immigrants | Ukraine | 98.7 /100 | #96 | Exceptional 11.6% |
| Latvians | 98.7 /100 | #97 | Exceptional 11.6% |
| Immigrants | Jordan | 98.6 /100 | #98 | Exceptional 11.6% |
| Immigrants | Sweden | 98.6 /100 | #99 | Exceptional 11.6% |
| Immigrants | Northern Europe | 98.6 /100 | #100 | Exceptional 11.6% |
| Immigrants | Guyana | 98.5 /100 | #101 | Exceptional 11.6% |
| Immigrants | Croatia | 98.3 /100 | #102 | Exceptional 11.6% |
| Maltese | 98.2 /100 | #103 | Exceptional 11.6% |
| Salvadorans | 98.2 /100 | #104 | Exceptional 11.6% |
| Immigrants | El Salvador | 97.9 /100 | #105 | Exceptional 11.7% |