Houma vs Egyptian Average Family Size
COMPARE
Houma
Egyptian
Average Family Size
Average Family Size Comparison
Houma
Egyptians
3.18
AVERAGE FAMILY SIZE
3.4/ 100
METRIC RATING
239th/ 347
METRIC RANK
3.23
AVERAGE FAMILY SIZE
58.6/ 100
METRIC RATING
164th/ 347
METRIC RANK
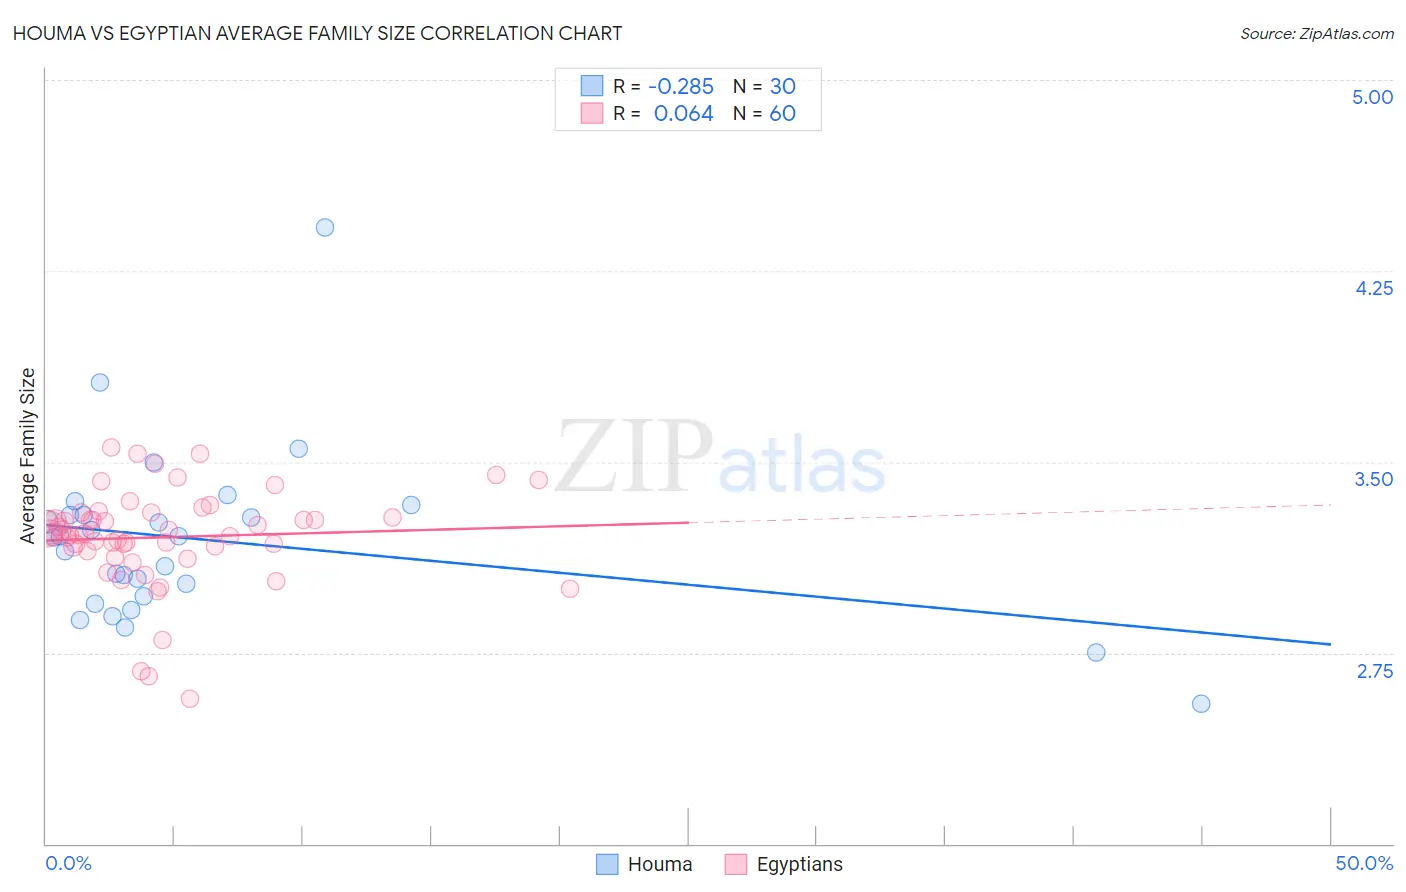
Houma vs Egyptian Average Family Size Correlation Chart
The statistical analysis conducted on geographies consisting of 36,793,313 people shows a weak negative correlation between the proportion of Houma and average family size in the United States with a correlation coefficient (R) of -0.285 and weighted average of 3.18. Similarly, the statistical analysis conducted on geographies consisting of 276,780,129 people shows a slight positive correlation between the proportion of Egyptians and average family size in the United States with a correlation coefficient (R) of 0.064 and weighted average of 3.23, a difference of 1.7%.
Average Family Size Correlation Summary
| Measurement | Houma | Egyptian |
| Minimum | 2.55 | 2.57 |
| Maximum | 4.42 | 3.56 |
| Range | 1.87 | 0.99 |
| Mean | 3.19 | 3.20 |
| Median | 3.20 | 3.22 |
| Interquartile 25% (IQ1) | 2.97 | 3.16 |
| Interquartile 75% (IQ3) | 3.29 | 3.29 |
| Interquartile Range (IQR) | 0.32 | 0.13 |
| Standard Deviation (Sample) | 0.34 | 0.19 |
| Standard Deviation (Population) | 0.34 | 0.19 |
Similar Demographics by Average Family Size
Demographics Similar to Houma by Average Family Size
In terms of average family size, the demographic groups most similar to Houma are Osage (3.18, a difference of 0.020%), Immigrants from Romania (3.18, a difference of 0.050%), Romanian (3.18, a difference of 0.050%), Immigrants from Japan (3.18, a difference of 0.050%), and Hungarian (3.18, a difference of 0.060%).
| Demographics | Rating | Rank | Average Family Size |
| Cherokee | 4.7 /100 | #232 | Tragic 3.18 |
| Brazilians | 4.5 /100 | #233 | Tragic 3.18 |
| Iranians | 4.5 /100 | #234 | Tragic 3.18 |
| Immigrants | Turkey | 4.2 /100 | #235 | Tragic 3.18 |
| Immigrants | Portugal | 4.2 /100 | #236 | Tragic 3.18 |
| Immigrants | Romania | 3.7 /100 | #237 | Tragic 3.18 |
| Romanians | 3.7 /100 | #238 | Tragic 3.18 |
| Houma | 3.4 /100 | #239 | Tragic 3.18 |
| Osage | 3.2 /100 | #240 | Tragic 3.18 |
| Immigrants | Japan | 3.0 /100 | #241 | Tragic 3.18 |
| Hungarians | 3.0 /100 | #242 | Tragic 3.18 |
| Immigrants | Moldova | 2.9 /100 | #243 | Tragic 3.18 |
| Immigrants | Southern Europe | 2.9 /100 | #244 | Tragic 3.18 |
| Immigrants | Brazil | 2.7 /100 | #245 | Tragic 3.18 |
| Danes | 2.5 /100 | #246 | Tragic 3.17 |
Demographics Similar to Egyptians by Average Family Size
In terms of average family size, the demographic groups most similar to Egyptians are Uruguayan (3.23, a difference of 0.0%), Ugandan (3.23, a difference of 0.0%), Immigrants from Senegal (3.23, a difference of 0.020%), Immigrants from Uganda (3.23, a difference of 0.030%), and Dutch West Indian (3.23, a difference of 0.030%).
| Demographics | Rating | Rank | Average Family Size |
| Immigrants | Uzbekistan | 67.0 /100 | #157 | Good 3.24 |
| Iraqis | 64.3 /100 | #158 | Good 3.24 |
| Ethiopians | 63.9 /100 | #159 | Good 3.24 |
| Immigrants | Iraq | 63.7 /100 | #160 | Good 3.24 |
| Immigrants | Chile | 63.2 /100 | #161 | Good 3.24 |
| Immigrants | Uganda | 60.1 /100 | #162 | Good 3.23 |
| Uruguayans | 58.8 /100 | #163 | Average 3.23 |
| Egyptians | 58.6 /100 | #164 | Average 3.23 |
| Ugandans | 58.4 /100 | #165 | Average 3.23 |
| Immigrants | Senegal | 57.5 /100 | #166 | Average 3.23 |
| Dutch West Indians | 56.9 /100 | #167 | Average 3.23 |
| Taiwanese | 54.2 /100 | #168 | Average 3.23 |
| Aleuts | 54.1 /100 | #169 | Average 3.23 |
| Arabs | 53.8 /100 | #170 | Average 3.23 |
| Chileans | 53.2 /100 | #171 | Average 3.23 |