Houma vs Cheyenne Average Family Size
COMPARE
Houma
Cheyenne
Average Family Size
Average Family Size Comparison
Houma
Cheyenne
3.18
AVERAGE FAMILY SIZE
3.4/ 100
METRIC RATING
239th/ 347
METRIC RANK
3.47
AVERAGE FAMILY SIZE
100.0/ 100
METRIC RATING
20th/ 347
METRIC RANK
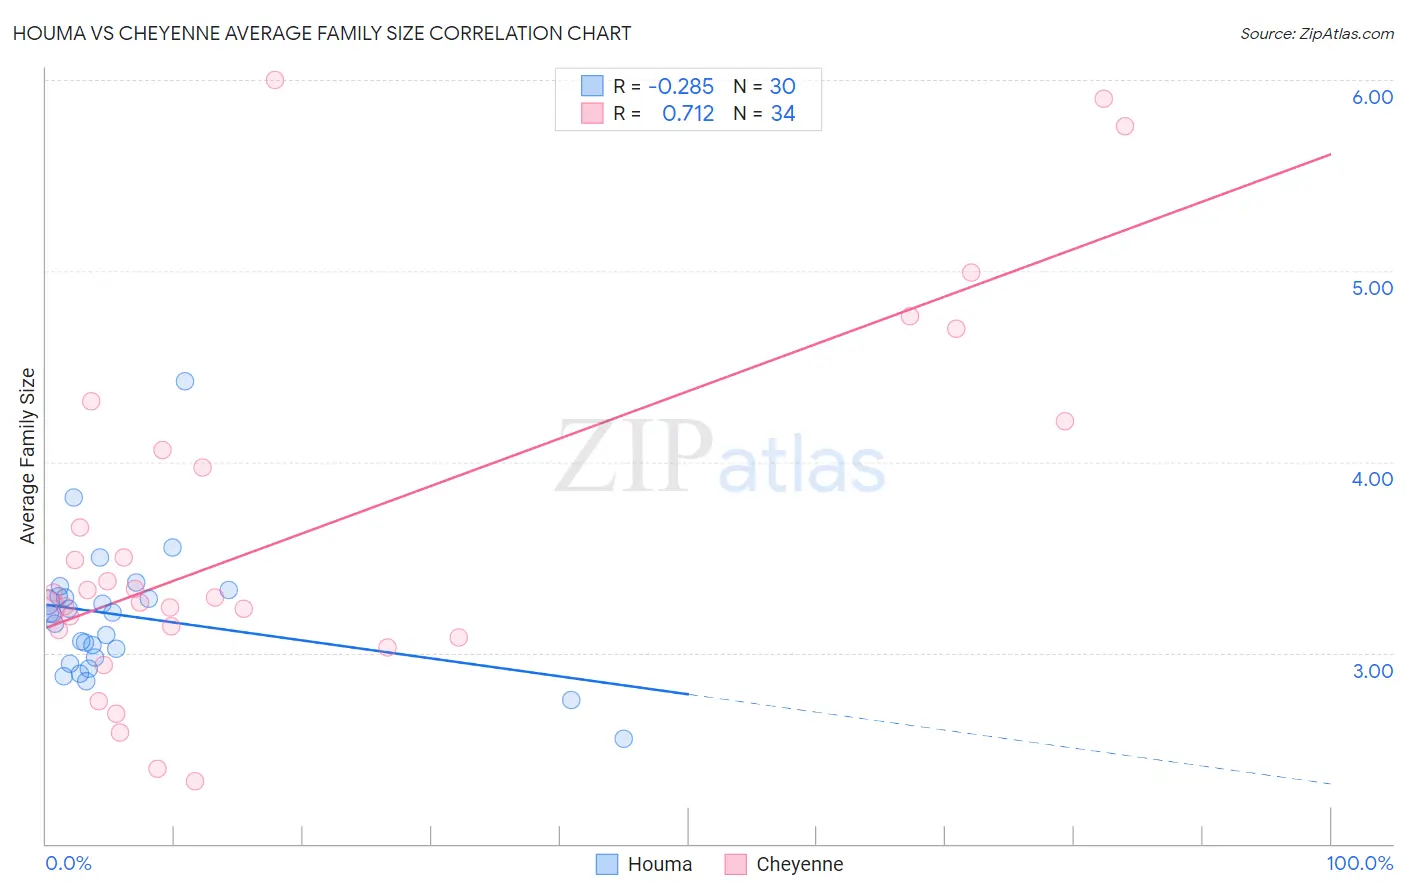
Houma vs Cheyenne Average Family Size Correlation Chart
The statistical analysis conducted on geographies consisting of 36,793,313 people shows a weak negative correlation between the proportion of Houma and average family size in the United States with a correlation coefficient (R) of -0.285 and weighted average of 3.18. Similarly, the statistical analysis conducted on geographies consisting of 80,705,196 people shows a strong positive correlation between the proportion of Cheyenne and average family size in the United States with a correlation coefficient (R) of 0.712 and weighted average of 3.47, a difference of 9.3%.
Average Family Size Correlation Summary
| Measurement | Houma | Cheyenne |
| Minimum | 2.55 | 2.33 |
| Maximum | 4.42 | 6.00 |
| Range | 1.87 | 3.67 |
| Mean | 3.19 | 3.63 |
| Median | 3.20 | 3.30 |
| Interquartile 25% (IQ1) | 2.97 | 3.12 |
| Interquartile 75% (IQ3) | 3.29 | 4.06 |
| Interquartile Range (IQR) | 0.32 | 0.94 |
| Standard Deviation (Sample) | 0.34 | 0.95 |
| Standard Deviation (Population) | 0.34 | 0.94 |
Similar Demographics by Average Family Size
Demographics Similar to Houma by Average Family Size
In terms of average family size, the demographic groups most similar to Houma are Osage (3.18, a difference of 0.020%), Immigrants from Romania (3.18, a difference of 0.050%), Romanian (3.18, a difference of 0.050%), Immigrants from Japan (3.18, a difference of 0.050%), and Hungarian (3.18, a difference of 0.060%).
| Demographics | Rating | Rank | Average Family Size |
| Cherokee | 4.7 /100 | #232 | Tragic 3.18 |
| Brazilians | 4.5 /100 | #233 | Tragic 3.18 |
| Iranians | 4.5 /100 | #234 | Tragic 3.18 |
| Immigrants | Turkey | 4.2 /100 | #235 | Tragic 3.18 |
| Immigrants | Portugal | 4.2 /100 | #236 | Tragic 3.18 |
| Immigrants | Romania | 3.7 /100 | #237 | Tragic 3.18 |
| Romanians | 3.7 /100 | #238 | Tragic 3.18 |
| Houma | 3.4 /100 | #239 | Tragic 3.18 |
| Osage | 3.2 /100 | #240 | Tragic 3.18 |
| Immigrants | Japan | 3.0 /100 | #241 | Tragic 3.18 |
| Hungarians | 3.0 /100 | #242 | Tragic 3.18 |
| Immigrants | Moldova | 2.9 /100 | #243 | Tragic 3.18 |
| Immigrants | Southern Europe | 2.9 /100 | #244 | Tragic 3.18 |
| Immigrants | Brazil | 2.7 /100 | #245 | Tragic 3.18 |
| Danes | 2.5 /100 | #246 | Tragic 3.17 |
Demographics Similar to Cheyenne by Average Family Size
In terms of average family size, the demographic groups most similar to Cheyenne are Mexican (3.48, a difference of 0.040%), Salvadoran (3.48, a difference of 0.11%), Yuman (3.47, a difference of 0.25%), Apache (3.46, a difference of 0.31%), and Immigrants from El Salvador (3.49, a difference of 0.36%).
| Demographics | Rating | Rank | Average Family Size |
| Sioux | 100.0 /100 | #13 | Exceptional 3.52 |
| Immigrants | Central America | 100.0 /100 | #14 | Exceptional 3.49 |
| Tongans | 100.0 /100 | #15 | Exceptional 3.49 |
| Ute | 100.0 /100 | #16 | Exceptional 3.49 |
| Immigrants | El Salvador | 100.0 /100 | #17 | Exceptional 3.49 |
| Salvadorans | 100.0 /100 | #18 | Exceptional 3.48 |
| Mexicans | 100.0 /100 | #19 | Exceptional 3.48 |
| Cheyenne | 100.0 /100 | #20 | Exceptional 3.47 |
| Yuman | 100.0 /100 | #21 | Exceptional 3.47 |
| Apache | 100.0 /100 | #22 | Exceptional 3.46 |
| Immigrants | Fiji | 100.0 /100 | #23 | Exceptional 3.45 |
| Natives/Alaskans | 100.0 /100 | #24 | Exceptional 3.45 |
| Yakama | 100.0 /100 | #25 | Exceptional 3.45 |
| Native Hawaiians | 100.0 /100 | #26 | Exceptional 3.43 |
| Mexican American Indians | 100.0 /100 | #27 | Exceptional 3.43 |