Houma vs Immigrants from Bahamas Average Family Size
COMPARE
Houma
Immigrants from Bahamas
Average Family Size
Average Family Size Comparison
Houma
Immigrants from Bahamas
3.18
AVERAGE FAMILY SIZE
3.4/ 100
METRIC RATING
239th/ 347
METRIC RANK
3.27
AVERAGE FAMILY SIZE
93.6/ 100
METRIC RATING
120th/ 347
METRIC RANK
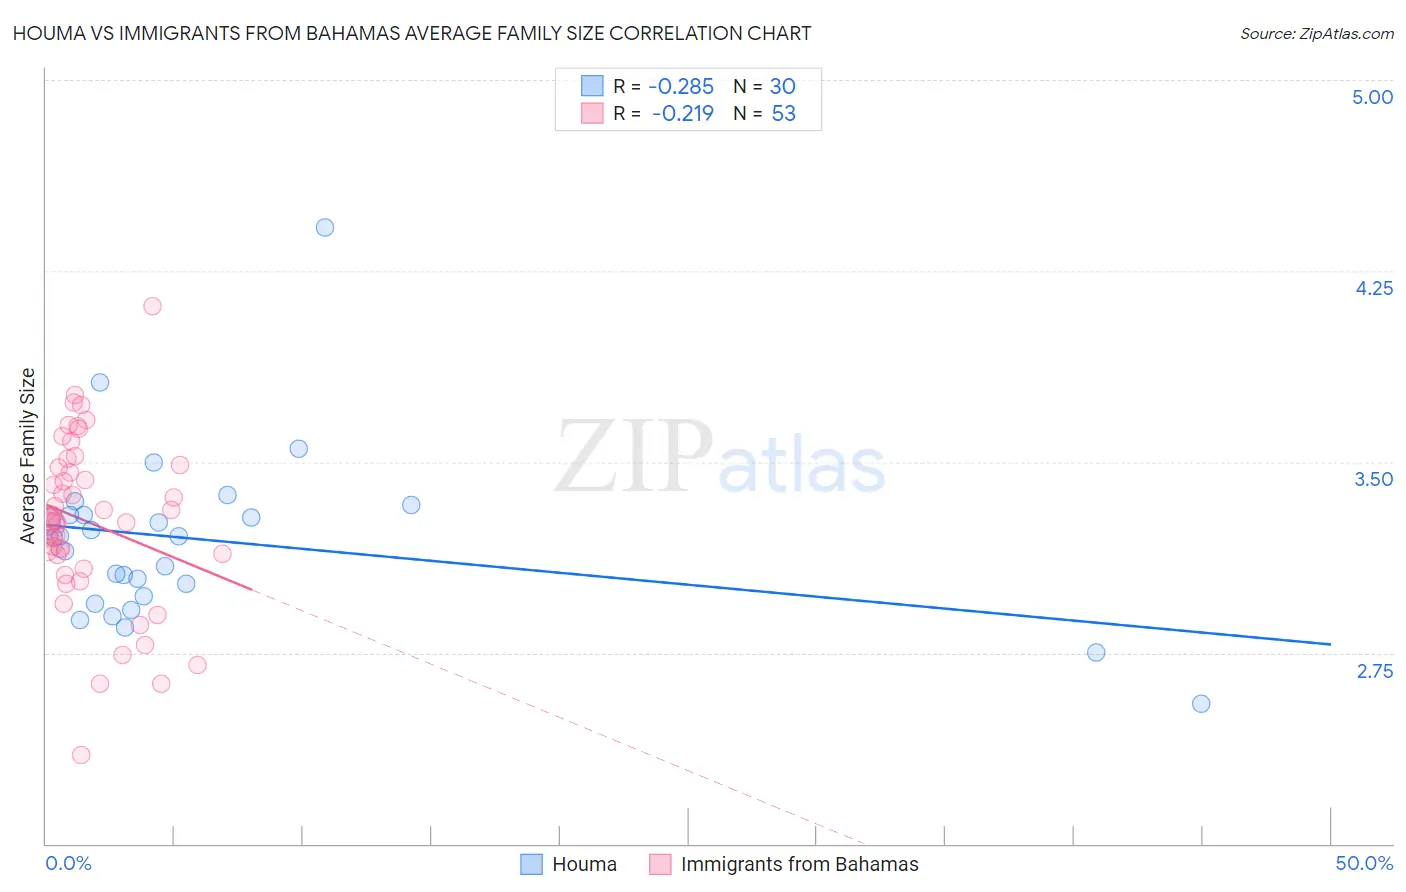
Houma vs Immigrants from Bahamas Average Family Size Correlation Chart
The statistical analysis conducted on geographies consisting of 36,793,313 people shows a weak negative correlation between the proportion of Houma and average family size in the United States with a correlation coefficient (R) of -0.285 and weighted average of 3.18. Similarly, the statistical analysis conducted on geographies consisting of 104,605,008 people shows a weak negative correlation between the proportion of Immigrants from Bahamas and average family size in the United States with a correlation coefficient (R) of -0.219 and weighted average of 3.27, a difference of 2.8%.
Average Family Size Correlation Summary
| Measurement | Houma | Immigrants from Bahamas |
| Minimum | 2.55 | 2.35 |
| Maximum | 4.42 | 4.11 |
| Range | 1.87 | 1.76 |
| Mean | 3.19 | 3.26 |
| Median | 3.20 | 3.27 |
| Interquartile 25% (IQ1) | 2.97 | 3.11 |
| Interquartile 75% (IQ3) | 3.29 | 3.48 |
| Interquartile Range (IQR) | 0.32 | 0.38 |
| Standard Deviation (Sample) | 0.34 | 0.33 |
| Standard Deviation (Population) | 0.34 | 0.33 |
Similar Demographics by Average Family Size
Demographics Similar to Houma by Average Family Size
In terms of average family size, the demographic groups most similar to Houma are Osage (3.18, a difference of 0.020%), Immigrants from Romania (3.18, a difference of 0.050%), Romanian (3.18, a difference of 0.050%), Immigrants from Japan (3.18, a difference of 0.050%), and Hungarian (3.18, a difference of 0.060%).
| Demographics | Rating | Rank | Average Family Size |
| Cherokee | 4.7 /100 | #232 | Tragic 3.18 |
| Brazilians | 4.5 /100 | #233 | Tragic 3.18 |
| Iranians | 4.5 /100 | #234 | Tragic 3.18 |
| Immigrants | Turkey | 4.2 /100 | #235 | Tragic 3.18 |
| Immigrants | Portugal | 4.2 /100 | #236 | Tragic 3.18 |
| Immigrants | Romania | 3.7 /100 | #237 | Tragic 3.18 |
| Romanians | 3.7 /100 | #238 | Tragic 3.18 |
| Houma | 3.4 /100 | #239 | Tragic 3.18 |
| Osage | 3.2 /100 | #240 | Tragic 3.18 |
| Immigrants | Japan | 3.0 /100 | #241 | Tragic 3.18 |
| Hungarians | 3.0 /100 | #242 | Tragic 3.18 |
| Immigrants | Moldova | 2.9 /100 | #243 | Tragic 3.18 |
| Immigrants | Southern Europe | 2.9 /100 | #244 | Tragic 3.18 |
| Immigrants | Brazil | 2.7 /100 | #245 | Tragic 3.18 |
| Danes | 2.5 /100 | #246 | Tragic 3.17 |
Demographics Similar to Immigrants from Bahamas by Average Family Size
In terms of average family size, the demographic groups most similar to Immigrants from Bahamas are Immigrants from Indonesia (3.27, a difference of 0.010%), Immigrants from Thailand (3.27, a difference of 0.020%), Immigrants from Asia (3.27, a difference of 0.030%), Immigrants from Colombia (3.27, a difference of 0.060%), and Alaskan Athabascan (3.27, a difference of 0.080%).
| Demographics | Rating | Rank | Average Family Size |
| Immigrants | Panama | 95.6 /100 | #113 | Exceptional 3.27 |
| South Americans | 95.1 /100 | #114 | Exceptional 3.27 |
| Immigrants | Liberia | 95.0 /100 | #115 | Exceptional 3.27 |
| Immigrants | South America | 95.0 /100 | #116 | Exceptional 3.27 |
| Kiowa | 94.8 /100 | #117 | Exceptional 3.27 |
| Immigrants | Asia | 94.0 /100 | #118 | Exceptional 3.27 |
| Immigrants | Indonesia | 93.7 /100 | #119 | Exceptional 3.27 |
| Immigrants | Bahamas | 93.6 /100 | #120 | Exceptional 3.27 |
| Immigrants | Thailand | 93.3 /100 | #121 | Exceptional 3.27 |
| Immigrants | Colombia | 92.8 /100 | #122 | Exceptional 3.27 |
| Alaskan Athabascans | 92.4 /100 | #123 | Exceptional 3.27 |
| South American Indians | 91.6 /100 | #124 | Exceptional 3.26 |
| Immigrants | Cuba | 91.3 /100 | #125 | Exceptional 3.26 |
| Immigrants | Costa Rica | 90.7 /100 | #126 | Exceptional 3.26 |
| Immigrants | Syria | 90.6 /100 | #127 | Exceptional 3.26 |