Houma vs Costa Rican In Labor Force | Age 30-34
COMPARE
Houma
Costa Rican
In Labor Force | Age 30-34
In Labor Force | Age 30-34 Comparison
Houma
Costa Ricans
79.9%
IN LABOR FORCE | AGE 30-34
0.0/ 100
METRIC RATING
331st/ 347
METRIC RANK
84.6%
IN LABOR FORCE | AGE 30-34
29.6/ 100
METRIC RATING
187th/ 347
METRIC RANK
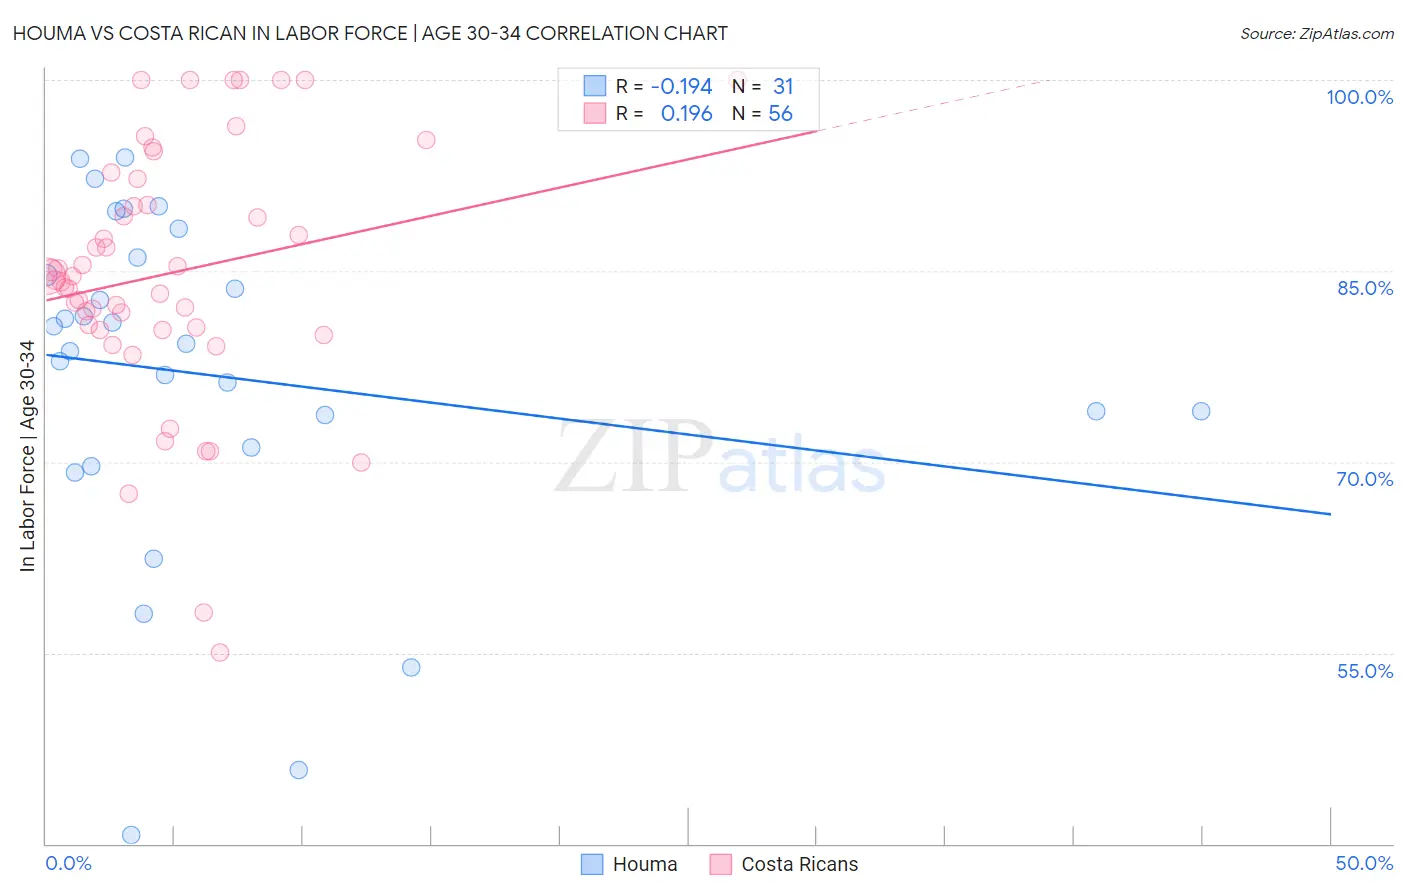
Houma vs Costa Rican In Labor Force | Age 30-34 Correlation Chart
The statistical analysis conducted on geographies consisting of 36,791,353 people shows a poor negative correlation between the proportion of Houma and labor force participation rate among population between the ages 30 and 34 in the United States with a correlation coefficient (R) of -0.194 and weighted average of 79.9%. Similarly, the statistical analysis conducted on geographies consisting of 253,513,435 people shows a poor positive correlation between the proportion of Costa Ricans and labor force participation rate among population between the ages 30 and 34 in the United States with a correlation coefficient (R) of 0.196 and weighted average of 84.6%, a difference of 5.8%.
In Labor Force | Age 30-34 Correlation Summary
| Measurement | Houma | Costa Rican |
| Minimum | 40.7% | 55.0% |
| Maximum | 93.9% | 100.0% |
| Range | 53.2% | 45.0% |
| Mean | 76.8% | 84.8% |
| Median | 79.3% | 84.4% |
| Interquartile 25% (IQ1) | 71.1% | 80.5% |
| Interquartile 75% (IQ3) | 86.1% | 91.2% |
| Interquartile Range (IQR) | 15.0% | 10.7% |
| Standard Deviation (Sample) | 13.3% | 10.0% |
| Standard Deviation (Population) | 13.1% | 9.9% |
Similar Demographics by In Labor Force | Age 30-34
Demographics Similar to Houma by In Labor Force | Age 30-34
In terms of in labor force | age 30-34, the demographic groups most similar to Houma are Kiowa (79.8%, a difference of 0.11%), Pueblo (80.0%, a difference of 0.17%), Inupiat (79.7%, a difference of 0.22%), Sioux (80.4%, a difference of 0.58%), and Creek (80.4%, a difference of 0.58%).
| Demographics | Rating | Rank | In Labor Force | Age 30-34 |
| Cheyenne | 0.0 /100 | #324 | Tragic 81.1% |
| Dutch West Indians | 0.0 /100 | #325 | Tragic 81.0% |
| Seminole | 0.0 /100 | #326 | Tragic 80.8% |
| Colville | 0.0 /100 | #327 | Tragic 80.7% |
| Sioux | 0.0 /100 | #328 | Tragic 80.4% |
| Creek | 0.0 /100 | #329 | Tragic 80.4% |
| Pueblo | 0.0 /100 | #330 | Tragic 80.0% |
| Houma | 0.0 /100 | #331 | Tragic 79.9% |
| Kiowa | 0.0 /100 | #332 | Tragic 79.8% |
| Inupiat | 0.0 /100 | #333 | Tragic 79.7% |
| Hopi | 0.0 /100 | #334 | Tragic 79.3% |
| Marshallese | 0.0 /100 | #335 | Tragic 79.2% |
| Natives/Alaskans | 0.0 /100 | #336 | Tragic 79.2% |
| Yakama | 0.0 /100 | #337 | Tragic 79.1% |
| Pima | 0.0 /100 | #338 | Tragic 79.0% |
Demographics Similar to Costa Ricans by In Labor Force | Age 30-34
In terms of in labor force | age 30-34, the demographic groups most similar to Costa Ricans are Immigrants from Congo (84.6%, a difference of 0.0%), Taiwanese (84.6%, a difference of 0.0%), Nigerian (84.5%, a difference of 0.010%), Immigrants from Philippines (84.6%, a difference of 0.020%), and Immigrants from North America (84.6%, a difference of 0.030%).
| Demographics | Rating | Rank | In Labor Force | Age 30-34 |
| Immigrants | Netherlands | 42.1 /100 | #180 | Average 84.6% |
| Moroccans | 40.3 /100 | #181 | Average 84.6% |
| Barbadians | 36.7 /100 | #182 | Fair 84.6% |
| Immigrants | Canada | 35.0 /100 | #183 | Fair 84.6% |
| Immigrants | North America | 33.3 /100 | #184 | Fair 84.6% |
| Immigrants | Philippines | 31.5 /100 | #185 | Fair 84.6% |
| Immigrants | Congo | 29.7 /100 | #186 | Fair 84.6% |
| Costa Ricans | 29.6 /100 | #187 | Fair 84.6% |
| Taiwanese | 29.4 /100 | #188 | Fair 84.6% |
| Nigerians | 28.9 /100 | #189 | Fair 84.5% |
| Immigrants | Zaire | 25.8 /100 | #190 | Fair 84.5% |
| Hungarians | 24.8 /100 | #191 | Fair 84.5% |
| Scandinavians | 24.7 /100 | #192 | Fair 84.5% |
| Immigrants | Costa Rica | 23.9 /100 | #193 | Fair 84.5% |
| Immigrants | Afghanistan | 23.5 /100 | #194 | Fair 84.5% |