Hopi vs Immigrants from Burma/Myanmar Births to Unmarried Women
COMPARE
Hopi
Immigrants from Burma/Myanmar
Births to Unmarried Women
Births to Unmarried Women Comparison
Hopi
Immigrants from Burma/Myanmar
50.8%
BIRTHS TO UNMARRIED WOMEN
0.0/ 100
METRIC RATING
341st/ 347
METRIC RANK
32.9%
BIRTHS TO UNMARRIED WOMEN
16.7/ 100
METRIC RATING
201st/ 347
METRIC RANK
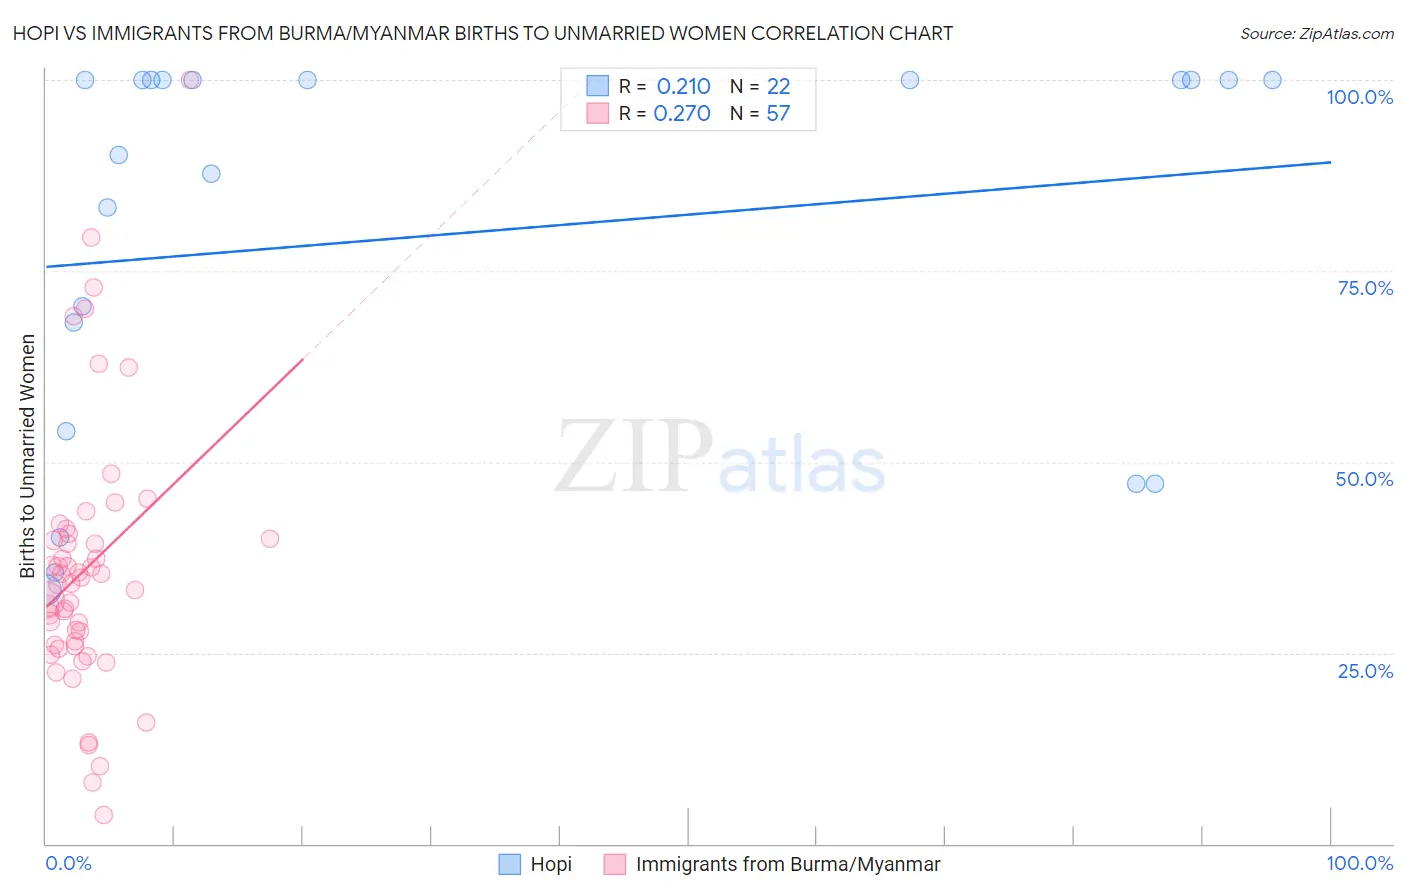
Hopi vs Immigrants from Burma/Myanmar Births to Unmarried Women Correlation Chart
The statistical analysis conducted on geographies consisting of 73,772,267 people shows a weak positive correlation between the proportion of Hopi and percentage of births to unmarried women in the United States with a correlation coefficient (R) of 0.210 and weighted average of 50.8%. Similarly, the statistical analysis conducted on geographies consisting of 166,895,809 people shows a weak positive correlation between the proportion of Immigrants from Burma/Myanmar and percentage of births to unmarried women in the United States with a correlation coefficient (R) of 0.270 and weighted average of 32.9%, a difference of 54.6%.
Births to Unmarried Women Correlation Summary
| Measurement | Hopi | Immigrants from Burma/Myanmar |
| Minimum | 33.2% | 3.8% |
| Maximum | 100.0% | 100.0% |
| Range | 66.8% | 96.2% |
| Mean | 79.9% | 36.0% |
| Median | 95.1% | 34.0% |
| Interquartile 25% (IQ1) | 54.0% | 25.9% |
| Interquartile 75% (IQ3) | 100.0% | 40.3% |
| Interquartile Range (IQR) | 46.0% | 14.4% |
| Standard Deviation (Sample) | 25.3% | 17.5% |
| Standard Deviation (Population) | 24.7% | 17.4% |
Similar Demographics by Births to Unmarried Women
Demographics Similar to Hopi by Births to Unmarried Women
In terms of births to unmarried women, the demographic groups most similar to Hopi are Menominee (51.1%, a difference of 0.59%), Pima (51.5%, a difference of 1.3%), Navajo (51.5%, a difference of 1.3%), Tohono O'odham (49.8%, a difference of 1.9%), and Inupiat (52.1%, a difference of 2.5%).
| Demographics | Rating | Rank | Births to Unmarried Women |
| Blacks/African Americans | 0.0 /100 | #333 | Tragic 44.3% |
| Yuman | 0.0 /100 | #334 | Tragic 44.4% |
| Colville | 0.0 /100 | #335 | Tragic 45.3% |
| Puerto Ricans | 0.0 /100 | #336 | Tragic 45.7% |
| Houma | 0.0 /100 | #337 | Tragic 46.6% |
| Arapaho | 0.0 /100 | #338 | Tragic 47.1% |
| Lumbee | 0.0 /100 | #339 | Tragic 48.2% |
| Tohono O'odham | 0.0 /100 | #340 | Tragic 49.8% |
| Hopi | 0.0 /100 | #341 | Tragic 50.8% |
| Menominee | 0.0 /100 | #342 | Tragic 51.1% |
| Pima | 0.0 /100 | #343 | Tragic 51.5% |
| Navajo | 0.0 /100 | #344 | Tragic 51.5% |
| Inupiat | 0.0 /100 | #345 | Tragic 52.1% |
| Pueblo | 0.0 /100 | #346 | Tragic 53.7% |
| Yup'ik | 0.0 /100 | #347 | Tragic 56.4% |
Demographics Similar to Immigrants from Burma/Myanmar by Births to Unmarried Women
In terms of births to unmarried women, the demographic groups most similar to Immigrants from Burma/Myanmar are Immigrants from Micronesia (32.9%, a difference of 0.010%), Immigrants from Germany (32.8%, a difference of 0.33%), Immigrants from Thailand (32.8%, a difference of 0.34%), Ute (33.0%, a difference of 0.39%), and Immigrants from Africa (33.0%, a difference of 0.41%).
| Demographics | Rating | Rank | Births to Unmarried Women |
| Sudanese | 27.3 /100 | #194 | Fair 32.4% |
| Samoans | 21.9 /100 | #195 | Fair 32.6% |
| Immigrants | Colombia | 21.7 /100 | #196 | Fair 32.6% |
| Immigrants | Immigrants | 20.6 /100 | #197 | Fair 32.7% |
| Costa Ricans | 20.3 /100 | #198 | Fair 32.7% |
| Immigrants | Thailand | 18.9 /100 | #199 | Poor 32.8% |
| Immigrants | Germany | 18.8 /100 | #200 | Poor 32.8% |
| Immigrants | Burma/Myanmar | 16.7 /100 | #201 | Poor 32.9% |
| Immigrants | Micronesia | 16.6 /100 | #202 | Poor 32.9% |
| Ute | 14.4 /100 | #203 | Poor 33.0% |
| Immigrants | Africa | 14.3 /100 | #204 | Poor 33.0% |
| German Russians | 13.1 /100 | #205 | Poor 33.1% |
| Uruguayans | 12.8 /100 | #206 | Poor 33.1% |
| Immigrants | Sudan | 11.5 /100 | #207 | Poor 33.2% |
| Hawaiians | 11.3 /100 | #208 | Poor 33.2% |