Hopi vs Immigrants from Norway Births to Unmarried Women
COMPARE
Hopi
Immigrants from Norway
Births to Unmarried Women
Births to Unmarried Women Comparison
Hopi
Immigrants from Norway
50.8%
BIRTHS TO UNMARRIED WOMEN
0.0/ 100
METRIC RATING
341st/ 347
METRIC RANK
29.9%
BIRTHS TO UNMARRIED WOMEN
91.0/ 100
METRIC RATING
118th/ 347
METRIC RANK
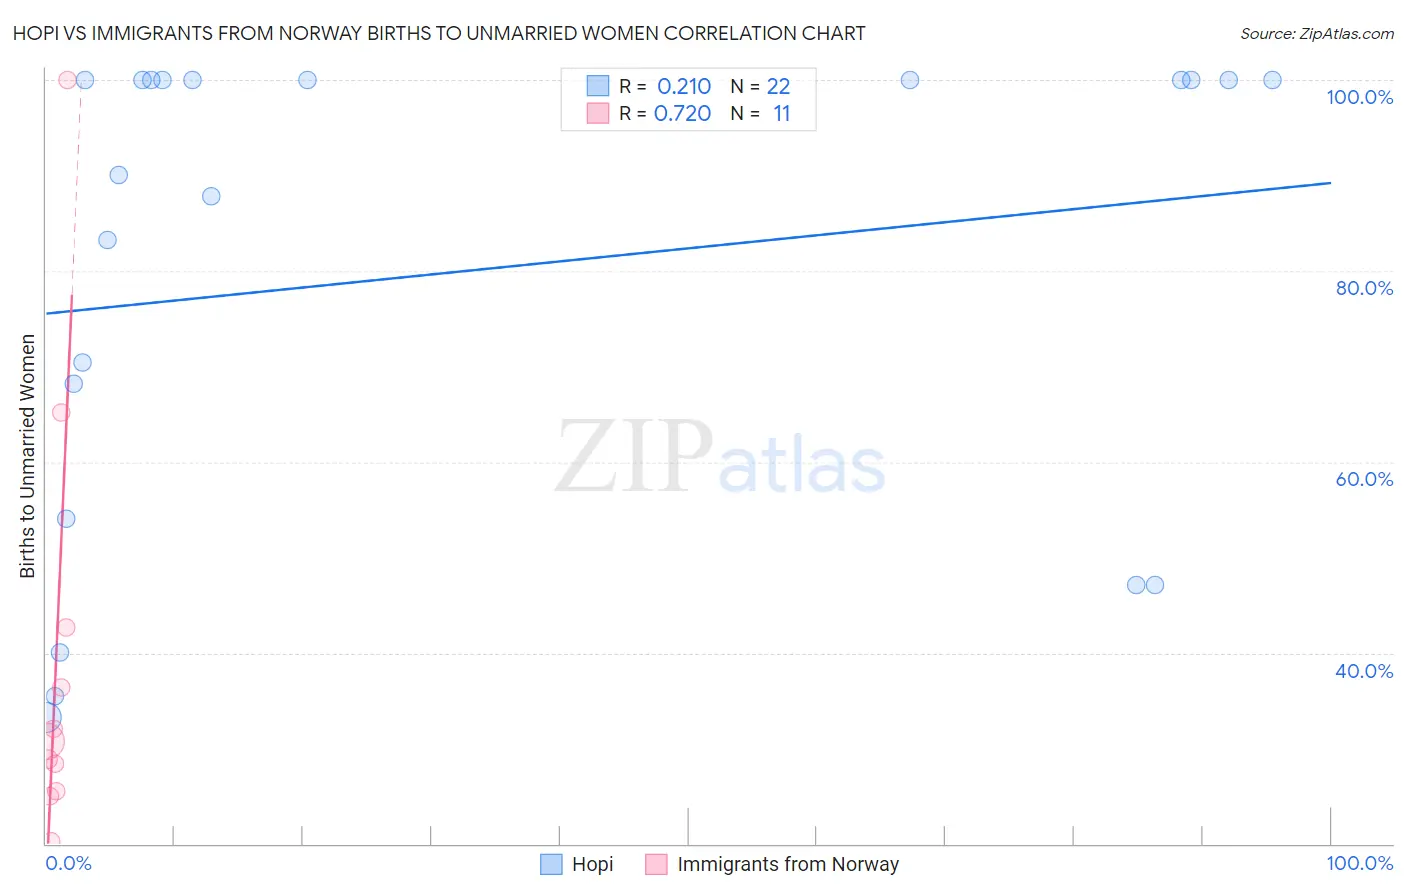
Hopi vs Immigrants from Norway Births to Unmarried Women Correlation Chart
The statistical analysis conducted on geographies consisting of 73,772,267 people shows a weak positive correlation between the proportion of Hopi and percentage of births to unmarried women in the United States with a correlation coefficient (R) of 0.210 and weighted average of 50.8%. Similarly, the statistical analysis conducted on geographies consisting of 112,150,385 people shows a strong positive correlation between the proportion of Immigrants from Norway and percentage of births to unmarried women in the United States with a correlation coefficient (R) of 0.720 and weighted average of 29.9%, a difference of 69.7%.
Births to Unmarried Women Correlation Summary
| Measurement | Hopi | Immigrants from Norway |
| Minimum | 33.2% | 20.3% |
| Maximum | 100.0% | 100.0% |
| Range | 66.8% | 79.7% |
| Mean | 79.9% | 39.6% |
| Median | 95.1% | 30.7% |
| Interquartile 25% (IQ1) | 54.0% | 25.5% |
| Interquartile 75% (IQ3) | 100.0% | 42.7% |
| Interquartile Range (IQR) | 46.0% | 17.2% |
| Standard Deviation (Sample) | 25.3% | 23.4% |
| Standard Deviation (Population) | 24.7% | 22.3% |
Similar Demographics by Births to Unmarried Women
Demographics Similar to Hopi by Births to Unmarried Women
In terms of births to unmarried women, the demographic groups most similar to Hopi are Menominee (51.1%, a difference of 0.59%), Pima (51.5%, a difference of 1.3%), Navajo (51.5%, a difference of 1.3%), Tohono O'odham (49.8%, a difference of 1.9%), and Inupiat (52.1%, a difference of 2.5%).
| Demographics | Rating | Rank | Births to Unmarried Women |
| Blacks/African Americans | 0.0 /100 | #333 | Tragic 44.3% |
| Yuman | 0.0 /100 | #334 | Tragic 44.4% |
| Colville | 0.0 /100 | #335 | Tragic 45.3% |
| Puerto Ricans | 0.0 /100 | #336 | Tragic 45.7% |
| Houma | 0.0 /100 | #337 | Tragic 46.6% |
| Arapaho | 0.0 /100 | #338 | Tragic 47.1% |
| Lumbee | 0.0 /100 | #339 | Tragic 48.2% |
| Tohono O'odham | 0.0 /100 | #340 | Tragic 49.8% |
| Hopi | 0.0 /100 | #341 | Tragic 50.8% |
| Menominee | 0.0 /100 | #342 | Tragic 51.1% |
| Pima | 0.0 /100 | #343 | Tragic 51.5% |
| Navajo | 0.0 /100 | #344 | Tragic 51.5% |
| Inupiat | 0.0 /100 | #345 | Tragic 52.1% |
| Pueblo | 0.0 /100 | #346 | Tragic 53.7% |
| Yup'ik | 0.0 /100 | #347 | Tragic 56.4% |
Demographics Similar to Immigrants from Norway by Births to Unmarried Women
In terms of births to unmarried women, the demographic groups most similar to Immigrants from Norway are Immigrants from Netherlands (29.9%, a difference of 0.020%), Argentinean (30.0%, a difference of 0.14%), Immigrants from Italy (29.9%, a difference of 0.23%), Ethiopian (29.8%, a difference of 0.31%), and Ugandan (30.1%, a difference of 0.50%).
| Demographics | Rating | Rank | Births to Unmarried Women |
| Immigrants | Hungary | 93.0 /100 | #111 | Exceptional 29.7% |
| Basques | 93.0 /100 | #112 | Exceptional 29.7% |
| Scandinavians | 92.7 /100 | #113 | Exceptional 29.8% |
| Immigrants | Croatia | 92.6 /100 | #114 | Exceptional 29.8% |
| Ethiopians | 91.9 /100 | #115 | Exceptional 29.8% |
| Immigrants | Italy | 91.7 /100 | #116 | Exceptional 29.9% |
| Immigrants | Netherlands | 91.1 /100 | #117 | Exceptional 29.9% |
| Immigrants | Norway | 91.0 /100 | #118 | Exceptional 29.9% |
| Argentineans | 90.5 /100 | #119 | Exceptional 30.0% |
| Ugandans | 89.2 /100 | #120 | Excellent 30.1% |
| Koreans | 88.9 /100 | #121 | Excellent 30.1% |
| Immigrants | Argentina | 88.7 /100 | #122 | Excellent 30.1% |
| Syrians | 88.2 /100 | #123 | Excellent 30.2% |
| Croatians | 88.0 /100 | #124 | Excellent 30.2% |
| Vietnamese | 87.7 /100 | #125 | Excellent 30.2% |