Canadian vs Immigrants from Burma/Myanmar Births to Unmarried Women
COMPARE
Canadian
Immigrants from Burma/Myanmar
Births to Unmarried Women
Births to Unmarried Women Comparison
Canadians
Immigrants from Burma/Myanmar
31.9%
BIRTHS TO UNMARRIED WOMEN
41.4/ 100
METRIC RATING
183rd/ 347
METRIC RANK
32.9%
BIRTHS TO UNMARRIED WOMEN
16.7/ 100
METRIC RATING
201st/ 347
METRIC RANK
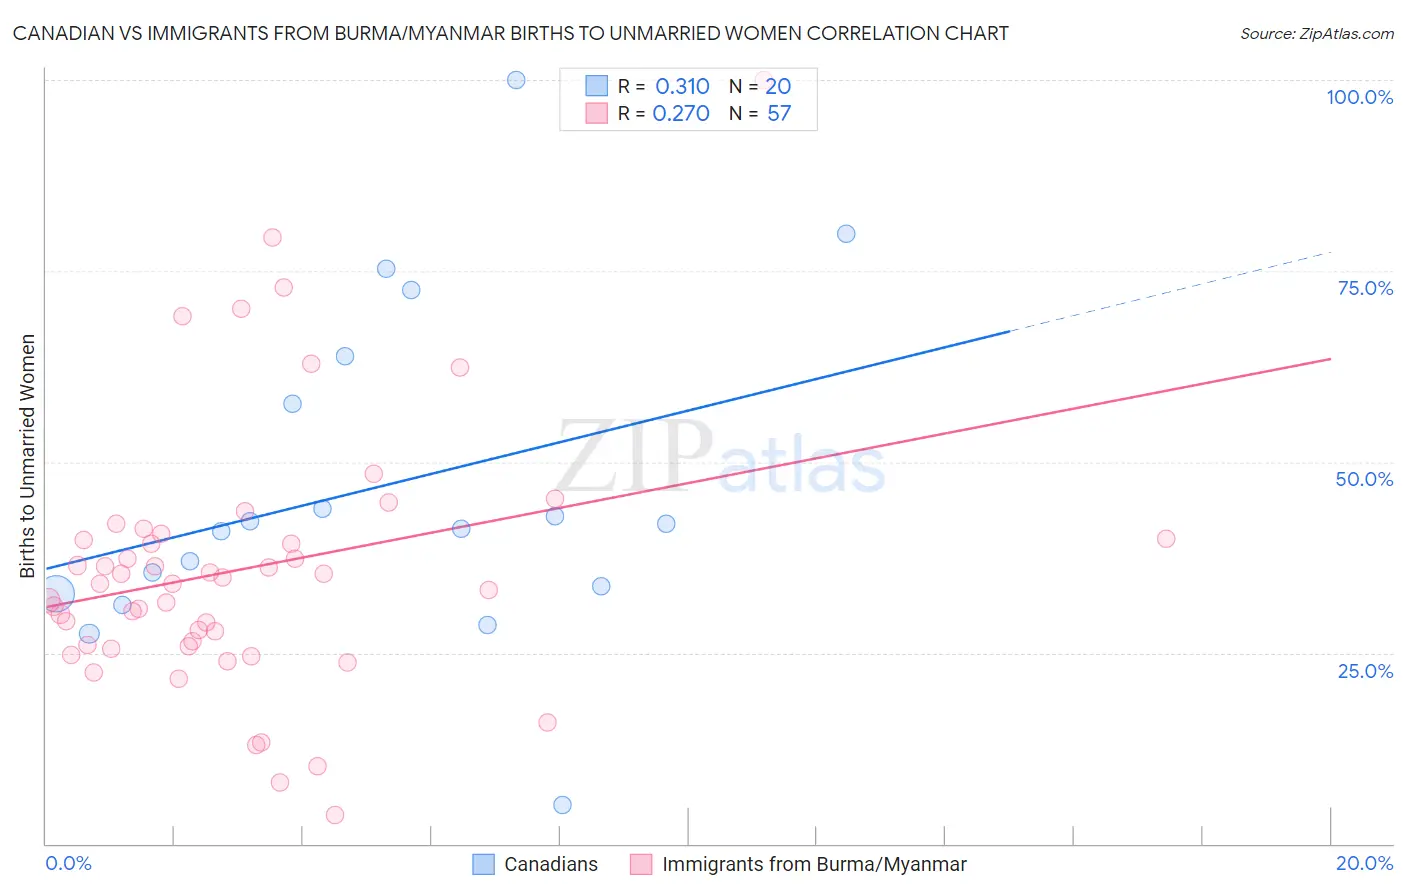
Canadian vs Immigrants from Burma/Myanmar Births to Unmarried Women Correlation Chart
The statistical analysis conducted on geographies consisting of 401,938,228 people shows a mild positive correlation between the proportion of Canadians and percentage of births to unmarried women in the United States with a correlation coefficient (R) of 0.310 and weighted average of 31.9%. Similarly, the statistical analysis conducted on geographies consisting of 166,895,809 people shows a weak positive correlation between the proportion of Immigrants from Burma/Myanmar and percentage of births to unmarried women in the United States with a correlation coefficient (R) of 0.270 and weighted average of 32.9%, a difference of 3.0%.
Births to Unmarried Women Correlation Summary
| Measurement | Canadian | Immigrants from Burma/Myanmar |
| Minimum | 5.0% | 3.8% |
| Maximum | 100.0% | 100.0% |
| Range | 95.0% | 96.2% |
| Mean | 46.7% | 36.0% |
| Median | 41.6% | 34.0% |
| Interquartile 25% (IQ1) | 33.2% | 25.9% |
| Interquartile 75% (IQ3) | 60.7% | 40.3% |
| Interquartile Range (IQR) | 27.6% | 14.4% |
| Standard Deviation (Sample) | 22.0% | 17.5% |
| Standard Deviation (Population) | 21.5% | 17.4% |
Demographics Similar to Canadians and Immigrants from Burma/Myanmar by Births to Unmarried Women
In terms of births to unmarried women, the demographic groups most similar to Canadians are Immigrants from South America (32.0%, a difference of 0.070%), Kenyan (31.9%, a difference of 0.16%), German (32.0%, a difference of 0.18%), Welsh (32.0%, a difference of 0.31%), and Czechoslovakian (32.0%, a difference of 0.33%). Similarly, the demographic groups most similar to Immigrants from Burma/Myanmar are Immigrants from Micronesia (32.9%, a difference of 0.010%), Immigrants from Germany (32.8%, a difference of 0.33%), Immigrants from Thailand (32.8%, a difference of 0.34%), Costa Rican (32.7%, a difference of 0.55%), and Immigrants (32.7%, a difference of 0.59%).
| Demographics | Rating | Rank | Births to Unmarried Women |
| Kenyans | 43.0 /100 | #182 | Average 31.9% |
| Canadians | 41.4 /100 | #183 | Average 31.9% |
| Immigrants | South America | 40.7 /100 | #184 | Average 32.0% |
| Germans | 39.5 /100 | #185 | Fair 32.0% |
| Welsh | 38.2 /100 | #186 | Fair 32.0% |
| Czechoslovakians | 38.0 /100 | #187 | Fair 32.0% |
| Osage | 37.1 /100 | #188 | Fair 32.1% |
| Immigrants | Kenya | 36.9 /100 | #189 | Fair 32.1% |
| Tlingit-Haida | 32.6 /100 | #190 | Fair 32.2% |
| Irish | 32.4 /100 | #191 | Fair 32.2% |
| Colombians | 31.9 /100 | #192 | Fair 32.2% |
| Fijians | 31.1 /100 | #193 | Fair 32.3% |
| Sudanese | 27.3 /100 | #194 | Fair 32.4% |
| Samoans | 21.9 /100 | #195 | Fair 32.6% |
| Immigrants | Colombia | 21.7 /100 | #196 | Fair 32.6% |
| Immigrants | Immigrants | 20.6 /100 | #197 | Fair 32.7% |
| Costa Ricans | 20.3 /100 | #198 | Fair 32.7% |
| Immigrants | Thailand | 18.9 /100 | #199 | Poor 32.8% |
| Immigrants | Germany | 18.8 /100 | #200 | Poor 32.8% |
| Immigrants | Burma/Myanmar | 16.7 /100 | #201 | Poor 32.9% |
| Immigrants | Micronesia | 16.6 /100 | #202 | Poor 32.9% |