Hopi vs Immigrants from Burma/Myanmar Disability Age Over 75
COMPARE
Hopi
Immigrants from Burma/Myanmar
Disability Age Over 75
Disability Age Over 75 Comparison
Hopi
Immigrants from Burma/Myanmar
52.9%
DISABILITY AGE OVER 75
0.0/ 100
METRIC RATING
331st/ 347
METRIC RANK
47.9%
DISABILITY AGE OVER 75
11.7/ 100
METRIC RATING
212th/ 347
METRIC RANK
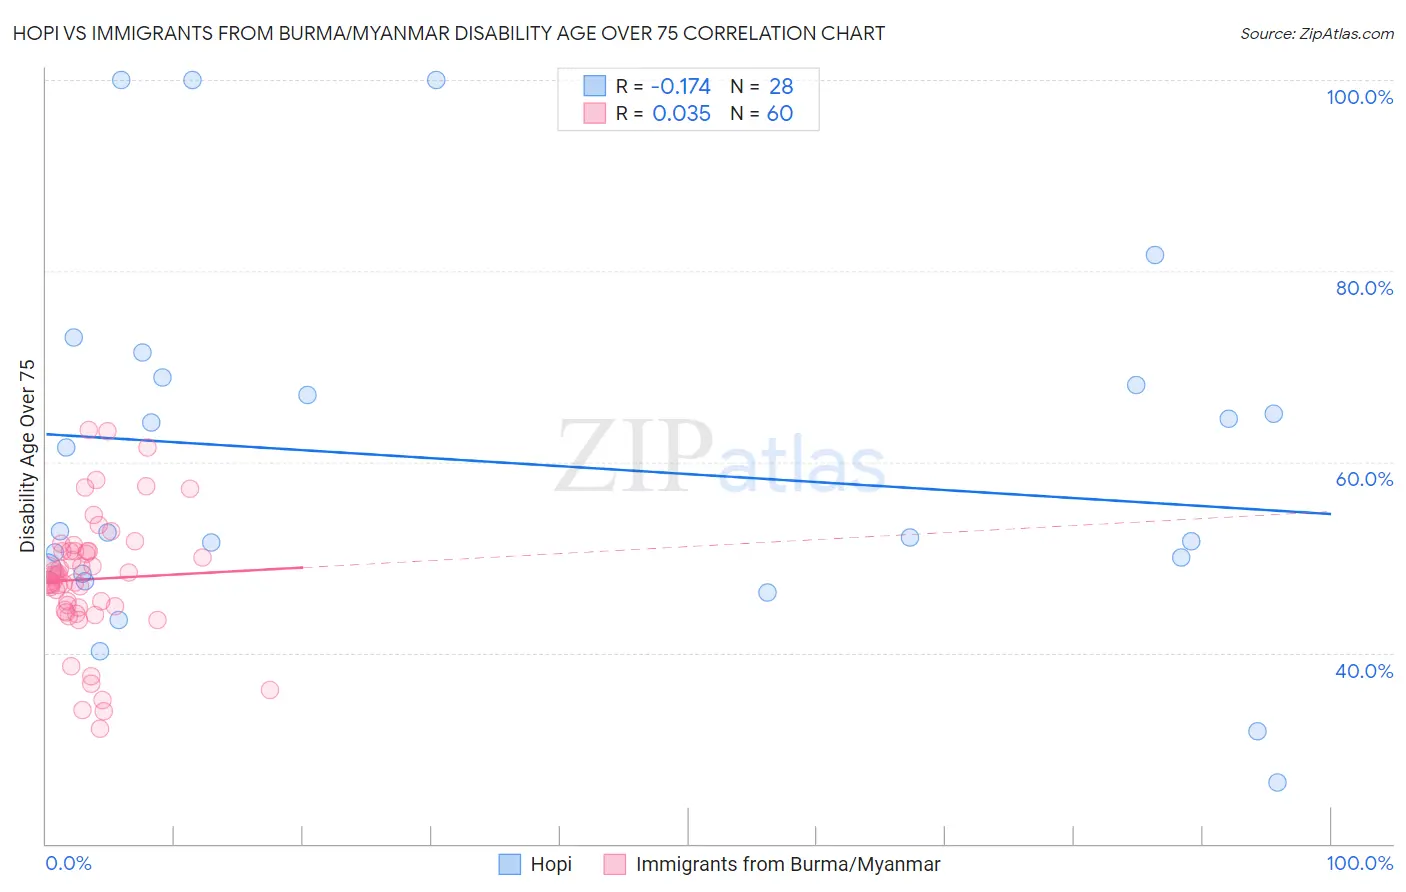
Hopi vs Immigrants from Burma/Myanmar Disability Age Over 75 Correlation Chart
The statistical analysis conducted on geographies consisting of 74,658,865 people shows a poor negative correlation between the proportion of Hopi and percentage of population with a disability over the age of 75 in the United States with a correlation coefficient (R) of -0.174 and weighted average of 52.9%. Similarly, the statistical analysis conducted on geographies consisting of 172,144,400 people shows no correlation between the proportion of Immigrants from Burma/Myanmar and percentage of population with a disability over the age of 75 in the United States with a correlation coefficient (R) of 0.035 and weighted average of 47.9%, a difference of 10.5%.
Disability Age Over 75 Correlation Summary
| Measurement | Hopi | Immigrants from Burma/Myanmar |
| Minimum | 26.4% | 32.0% |
| Maximum | 100.0% | 63.4% |
| Range | 73.6% | 31.4% |
| Mean | 60.0% | 47.7% |
| Median | 52.7% | 48.1% |
| Interquartile 25% (IQ1) | 48.5% | 44.6% |
| Interquartile 75% (IQ3) | 68.5% | 50.7% |
| Interquartile Range (IQR) | 20.0% | 6.1% |
| Standard Deviation (Sample) | 18.8% | 6.7% |
| Standard Deviation (Population) | 18.5% | 6.6% |
Similar Demographics by Disability Age Over 75
Demographics Similar to Hopi by Disability Age Over 75
In terms of disability age over 75, the demographic groups most similar to Hopi are Puerto Rican (52.9%, a difference of 0.020%), Alaska Native (52.8%, a difference of 0.19%), Native/Alaskan (53.1%, a difference of 0.29%), Choctaw (52.7%, a difference of 0.41%), and Nepalese (52.6%, a difference of 0.60%).
| Demographics | Rating | Rank | Disability Age Over 75 |
| Menominee | 0.0 /100 | #324 | Tragic 52.3% |
| Immigrants | Cabo Verde | 0.0 /100 | #325 | Tragic 52.4% |
| Ute | 0.0 /100 | #326 | Tragic 52.6% |
| Nepalese | 0.0 /100 | #327 | Tragic 52.6% |
| Choctaw | 0.0 /100 | #328 | Tragic 52.7% |
| Alaska Natives | 0.0 /100 | #329 | Tragic 52.8% |
| Puerto Ricans | 0.0 /100 | #330 | Tragic 52.9% |
| Hopi | 0.0 /100 | #331 | Tragic 52.9% |
| Natives/Alaskans | 0.0 /100 | #332 | Tragic 53.1% |
| Apache | 0.0 /100 | #333 | Tragic 53.6% |
| Alaskan Athabascans | 0.0 /100 | #334 | Tragic 54.0% |
| Kiowa | 0.0 /100 | #335 | Tragic 54.2% |
| Immigrants | Armenia | 0.0 /100 | #336 | Tragic 54.3% |
| Yuman | 0.0 /100 | #337 | Tragic 54.4% |
| Colville | 0.0 /100 | #338 | Tragic 55.4% |
Demographics Similar to Immigrants from Burma/Myanmar by Disability Age Over 75
In terms of disability age over 75, the demographic groups most similar to Immigrants from Burma/Myanmar are Panamanian (47.9%, a difference of 0.0%), Vietnamese (47.9%, a difference of 0.010%), Laotian (47.9%, a difference of 0.010%), Immigrants from Barbados (47.9%, a difference of 0.060%), and Senegalese (47.9%, a difference of 0.060%).
| Demographics | Rating | Rank | Disability Age Over 75 |
| Immigrants | Ghana | 19.1 /100 | #205 | Poor 47.7% |
| Jamaicans | 19.0 /100 | #206 | Poor 47.7% |
| Immigrants | Syria | 17.4 /100 | #207 | Poor 47.8% |
| Immigrants | Senegal | 16.9 /100 | #208 | Poor 47.8% |
| Immigrants | Indonesia | 14.2 /100 | #209 | Poor 47.8% |
| Vietnamese | 11.9 /100 | #210 | Poor 47.9% |
| Panamanians | 11.8 /100 | #211 | Poor 47.9% |
| Immigrants | Burma/Myanmar | 11.7 /100 | #212 | Poor 47.9% |
| Laotians | 11.5 /100 | #213 | Poor 47.9% |
| Immigrants | Barbados | 10.7 /100 | #214 | Poor 47.9% |
| Senegalese | 10.7 /100 | #215 | Poor 47.9% |
| Immigrants | Panama | 10.2 /100 | #216 | Poor 47.9% |
| Immigrants | Grenada | 9.4 /100 | #217 | Tragic 47.9% |
| Immigrants | Western Africa | 8.3 /100 | #218 | Tragic 48.0% |
| Immigrants | Western Asia | 7.5 /100 | #219 | Tragic 48.0% |