Central American vs Immigrants from Burma/Myanmar Births to Unmarried Women
COMPARE
Central American
Immigrants from Burma/Myanmar
Births to Unmarried Women
Births to Unmarried Women Comparison
Central Americans
Immigrants from Burma/Myanmar
36.7%
BIRTHS TO UNMARRIED WOMEN
0.1/ 100
METRIC RATING
267th/ 347
METRIC RANK
32.9%
BIRTHS TO UNMARRIED WOMEN
16.7/ 100
METRIC RATING
201st/ 347
METRIC RANK
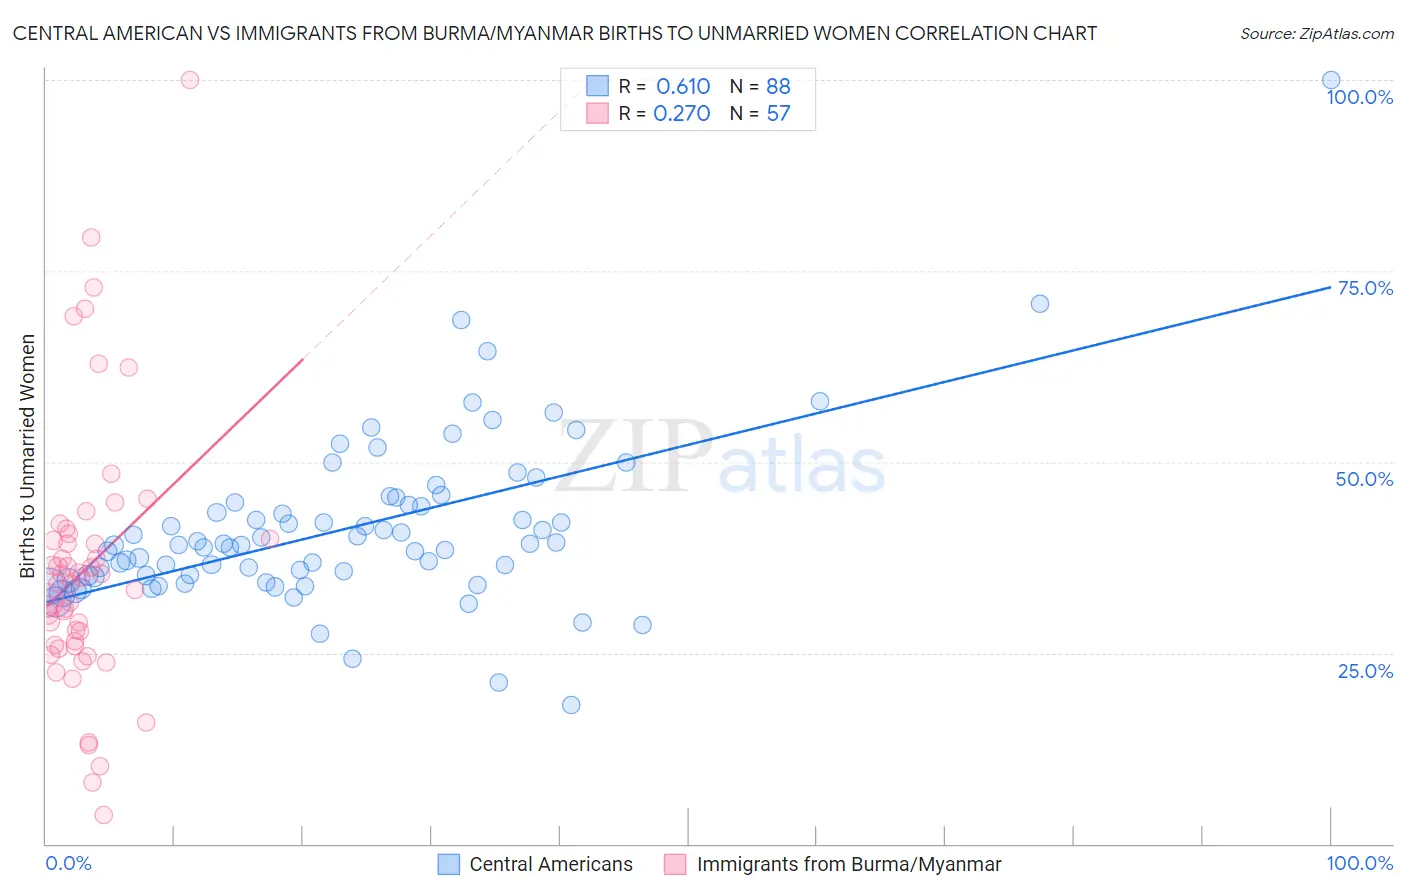
Central American vs Immigrants from Burma/Myanmar Births to Unmarried Women Correlation Chart
The statistical analysis conducted on geographies consisting of 464,543,910 people shows a significant positive correlation between the proportion of Central Americans and percentage of births to unmarried women in the United States with a correlation coefficient (R) of 0.610 and weighted average of 36.7%. Similarly, the statistical analysis conducted on geographies consisting of 166,895,809 people shows a weak positive correlation between the proportion of Immigrants from Burma/Myanmar and percentage of births to unmarried women in the United States with a correlation coefficient (R) of 0.270 and weighted average of 32.9%, a difference of 11.7%.
Births to Unmarried Women Correlation Summary
| Measurement | Central American | Immigrants from Burma/Myanmar |
| Minimum | 18.1% | 3.8% |
| Maximum | 100.0% | 100.0% |
| Range | 81.9% | 96.2% |
| Mean | 41.3% | 36.0% |
| Median | 39.1% | 34.0% |
| Interquartile 25% (IQ1) | 35.0% | 25.9% |
| Interquartile 75% (IQ3) | 44.6% | 40.3% |
| Interquartile Range (IQR) | 9.5% | 14.4% |
| Standard Deviation (Sample) | 11.2% | 17.5% |
| Standard Deviation (Population) | 11.1% | 17.4% |
Similar Demographics by Births to Unmarried Women
Demographics Similar to Central Americans by Births to Unmarried Women
In terms of births to unmarried women, the demographic groups most similar to Central Americans are Comanche (36.7%, a difference of 0.010%), Immigrants from Senegal (36.7%, a difference of 0.070%), Cherokee (36.7%, a difference of 0.12%), Senegalese (36.8%, a difference of 0.13%), and Subsaharan African (36.7%, a difference of 0.17%).
| Demographics | Rating | Rank | Births to Unmarried Women |
| Ottawa | 0.2 /100 | #260 | Tragic 36.5% |
| Trinidadians and Tobagonians | 0.2 /100 | #261 | Tragic 36.5% |
| French American Indians | 0.1 /100 | #262 | Tragic 36.6% |
| Nicaraguans | 0.1 /100 | #263 | Tragic 36.6% |
| Sub-Saharan Africans | 0.1 /100 | #264 | Tragic 36.7% |
| Cherokee | 0.1 /100 | #265 | Tragic 36.7% |
| Immigrants | Senegal | 0.1 /100 | #266 | Tragic 36.7% |
| Central Americans | 0.1 /100 | #267 | Tragic 36.7% |
| Comanche | 0.1 /100 | #268 | Tragic 36.7% |
| Senegalese | 0.1 /100 | #269 | Tragic 36.8% |
| Immigrants | Congo | 0.1 /100 | #270 | Tragic 36.8% |
| Immigrants | Barbados | 0.1 /100 | #271 | Tragic 36.8% |
| Choctaw | 0.1 /100 | #272 | Tragic 36.9% |
| Mexicans | 0.1 /100 | #273 | Tragic 36.9% |
| Cree | 0.1 /100 | #274 | Tragic 37.0% |
Demographics Similar to Immigrants from Burma/Myanmar by Births to Unmarried Women
In terms of births to unmarried women, the demographic groups most similar to Immigrants from Burma/Myanmar are Immigrants from Micronesia (32.9%, a difference of 0.010%), Immigrants from Germany (32.8%, a difference of 0.33%), Immigrants from Thailand (32.8%, a difference of 0.34%), Ute (33.0%, a difference of 0.39%), and Immigrants from Africa (33.0%, a difference of 0.41%).
| Demographics | Rating | Rank | Births to Unmarried Women |
| Sudanese | 27.3 /100 | #194 | Fair 32.4% |
| Samoans | 21.9 /100 | #195 | Fair 32.6% |
| Immigrants | Colombia | 21.7 /100 | #196 | Fair 32.6% |
| Immigrants | Immigrants | 20.6 /100 | #197 | Fair 32.7% |
| Costa Ricans | 20.3 /100 | #198 | Fair 32.7% |
| Immigrants | Thailand | 18.9 /100 | #199 | Poor 32.8% |
| Immigrants | Germany | 18.8 /100 | #200 | Poor 32.8% |
| Immigrants | Burma/Myanmar | 16.7 /100 | #201 | Poor 32.9% |
| Immigrants | Micronesia | 16.6 /100 | #202 | Poor 32.9% |
| Ute | 14.4 /100 | #203 | Poor 33.0% |
| Immigrants | Africa | 14.3 /100 | #204 | Poor 33.0% |
| German Russians | 13.1 /100 | #205 | Poor 33.1% |
| Uruguayans | 12.8 /100 | #206 | Poor 33.1% |
| Immigrants | Sudan | 11.5 /100 | #207 | Poor 33.2% |
| Hawaiians | 11.3 /100 | #208 | Poor 33.2% |