Honduran vs Yaqui Births to Unmarried Women
COMPARE
Honduran
Yaqui
Births to Unmarried Women
Births to Unmarried Women Comparison
Hondurans
Yaqui
38.7%
BIRTHS TO UNMARRIED WOMEN
0.0/ 100
METRIC RATING
302nd/ 347
METRIC RANK
38.8%
BIRTHS TO UNMARRIED WOMEN
0.0/ 100
METRIC RATING
304th/ 347
METRIC RANK
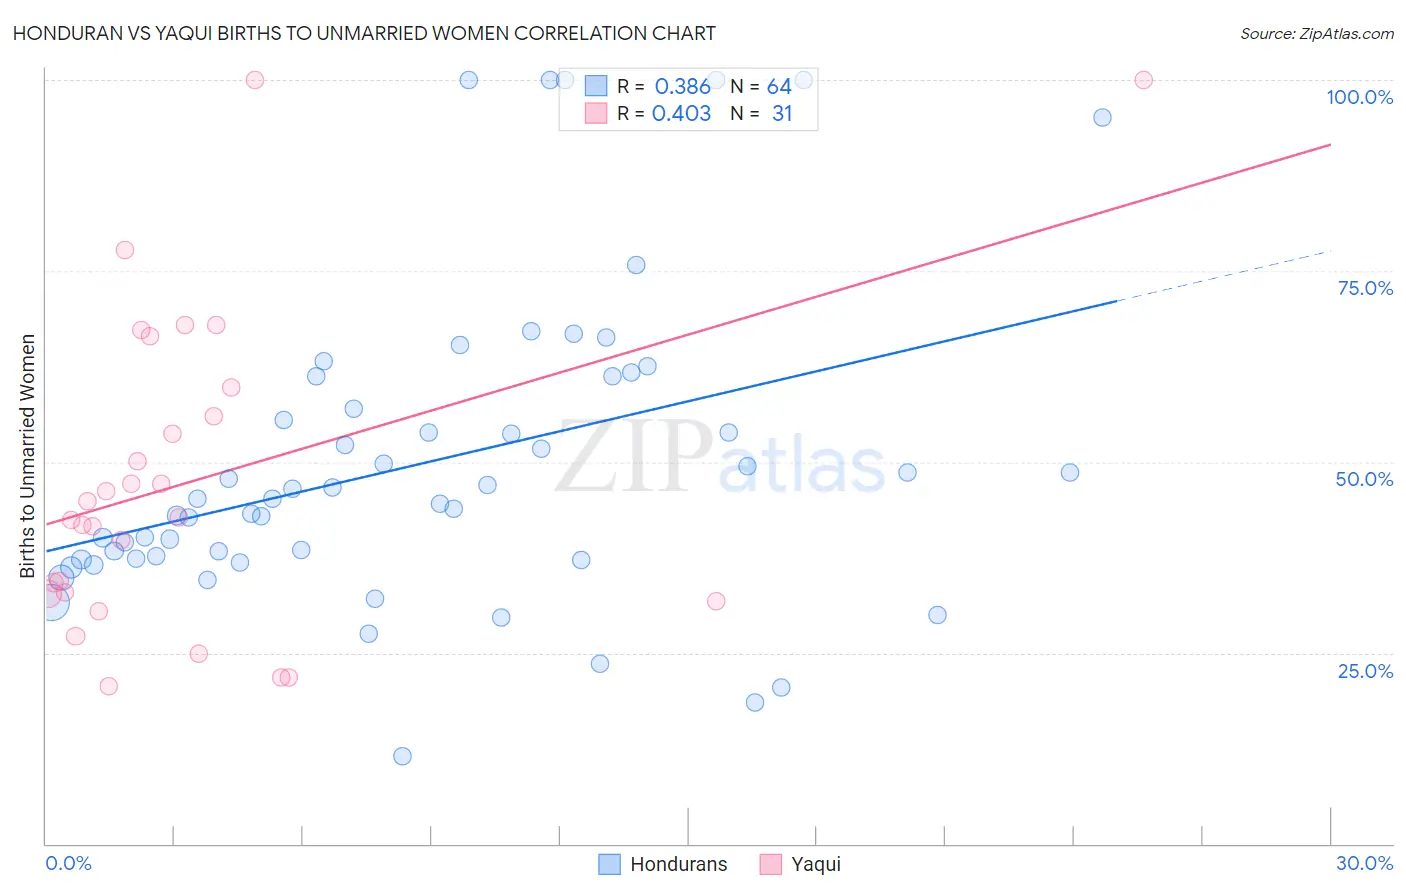
Honduran vs Yaqui Births to Unmarried Women Correlation Chart
The statistical analysis conducted on geographies consisting of 342,571,212 people shows a mild positive correlation between the proportion of Hondurans and percentage of births to unmarried women in the United States with a correlation coefficient (R) of 0.386 and weighted average of 38.7%. Similarly, the statistical analysis conducted on geographies consisting of 105,518,851 people shows a moderate positive correlation between the proportion of Yaqui and percentage of births to unmarried women in the United States with a correlation coefficient (R) of 0.403 and weighted average of 38.8%, a difference of 0.37%.
Births to Unmarried Women Correlation Summary
| Measurement | Honduran | Yaqui |
| Minimum | 11.5% | 20.6% |
| Maximum | 100.0% | 100.0% |
| Range | 88.5% | 79.4% |
| Mean | 49.8% | 47.5% |
| Median | 45.2% | 42.7% |
| Interquartile 25% (IQ1) | 37.3% | 32.8% |
| Interquartile 75% (IQ3) | 59.0% | 59.7% |
| Interquartile Range (IQR) | 21.8% | 26.9% |
| Standard Deviation (Sample) | 20.3% | 20.6% |
| Standard Deviation (Population) | 20.1% | 20.3% |
Demographics Similar to Hondurans and Yaqui by Births to Unmarried Women
In terms of births to unmarried women, the demographic groups most similar to Hondurans are Haitian (38.6%, a difference of 0.24%), Immigrants from West Indies (38.6%, a difference of 0.25%), Spanish American (38.6%, a difference of 0.31%), Immigrants from Jamaica (38.8%, a difference of 0.32%), and Immigrants from Haiti (38.9%, a difference of 0.47%). Similarly, the demographic groups most similar to Yaqui are Immigrants from Jamaica (38.8%, a difference of 0.050%), Immigrants from Haiti (38.9%, a difference of 0.10%), Central American Indian (39.0%, a difference of 0.39%), Haitian (38.6%, a difference of 0.61%), and Immigrants from West Indies (38.6%, a difference of 0.62%).
| Demographics | Rating | Rank | Births to Unmarried Women |
| Immigrants | Nicaragua | 0.0 /100 | #293 | Tragic 38.0% |
| British West Indians | 0.0 /100 | #294 | Tragic 38.0% |
| Iroquois | 0.0 /100 | #295 | Tragic 38.2% |
| Alaska Natives | 0.0 /100 | #296 | Tragic 38.3% |
| Dutch West Indians | 0.0 /100 | #297 | Tragic 38.4% |
| Jamaicans | 0.0 /100 | #298 | Tragic 38.5% |
| Spanish Americans | 0.0 /100 | #299 | Tragic 38.6% |
| Immigrants | West Indies | 0.0 /100 | #300 | Tragic 38.6% |
| Haitians | 0.0 /100 | #301 | Tragic 38.6% |
| Hondurans | 0.0 /100 | #302 | Tragic 38.7% |
| Immigrants | Jamaica | 0.0 /100 | #303 | Tragic 38.8% |
| Yaqui | 0.0 /100 | #304 | Tragic 38.8% |
| Immigrants | Haiti | 0.0 /100 | #305 | Tragic 38.9% |
| Central American Indians | 0.0 /100 | #306 | Tragic 39.0% |
| Immigrants | Honduras | 0.0 /100 | #307 | Tragic 39.3% |
| Aleuts | 0.0 /100 | #308 | Tragic 39.3% |
| Cubans | 0.0 /100 | #309 | Tragic 39.4% |
| Immigrants | Dominica | 0.0 /100 | #310 | Tragic 39.5% |
| Immigrants | Azores | 0.0 /100 | #311 | Tragic 39.6% |
| U.S. Virgin Islanders | 0.0 /100 | #312 | Tragic 39.6% |
| Africans | 0.0 /100 | #313 | Tragic 39.7% |