Lebanese vs Navajo Births to Unmarried Women
COMPARE
Lebanese
Navajo
Births to Unmarried Women
Births to Unmarried Women Comparison
Lebanese
Navajo
29.5%
BIRTHS TO UNMARRIED WOMEN
94.4/ 100
METRIC RATING
103rd/ 347
METRIC RANK
51.5%
BIRTHS TO UNMARRIED WOMEN
0.0/ 100
METRIC RATING
344th/ 347
METRIC RANK
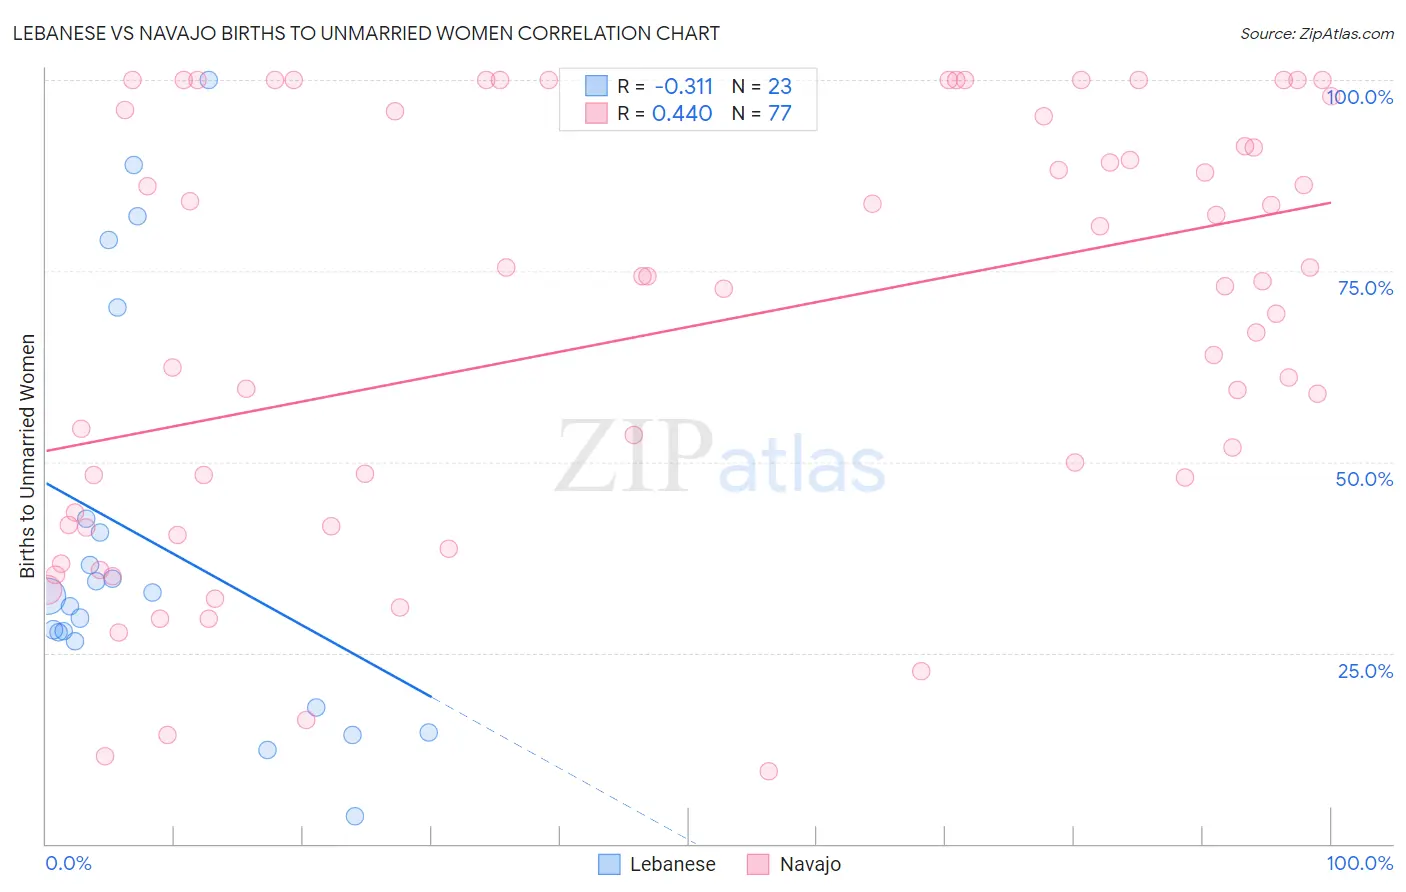
Lebanese vs Navajo Births to Unmarried Women Correlation Chart
The statistical analysis conducted on geographies consisting of 372,610,698 people shows a mild negative correlation between the proportion of Lebanese and percentage of births to unmarried women in the United States with a correlation coefficient (R) of -0.311 and weighted average of 29.5%. Similarly, the statistical analysis conducted on geographies consisting of 217,645,361 people shows a moderate positive correlation between the proportion of Navajo and percentage of births to unmarried women in the United States with a correlation coefficient (R) of 0.440 and weighted average of 51.5%, a difference of 74.3%.
Births to Unmarried Women Correlation Summary
| Measurement | Lebanese | Navajo |
| Minimum | 3.6% | 9.5% |
| Maximum | 100.0% | 100.0% |
| Range | 96.4% | 90.5% |
| Mean | 39.5% | 67.3% |
| Median | 32.4% | 72.9% |
| Interquartile 25% (IQ1) | 26.4% | 41.6% |
| Interquartile 75% (IQ3) | 42.6% | 95.6% |
| Interquartile Range (IQR) | 16.2% | 54.0% |
| Standard Deviation (Sample) | 26.2% | 27.7% |
| Standard Deviation (Population) | 25.6% | 27.6% |
Similar Demographics by Births to Unmarried Women
Demographics Similar to Lebanese by Births to Unmarried Women
In terms of births to unmarried women, the demographic groups most similar to Lebanese are Lithuanian (29.6%, a difference of 0.010%), Australian (29.5%, a difference of 0.050%), Immigrants from Nepal (29.6%, a difference of 0.060%), Immigrants from Northern Africa (29.5%, a difference of 0.13%), and Swedish (29.6%, a difference of 0.32%).
| Demographics | Rating | Rank | Births to Unmarried Women |
| Norwegians | 95.8 /100 | #96 | Exceptional 29.3% |
| Immigrants | South Africa | 95.7 /100 | #97 | Exceptional 29.3% |
| Immigrants | Syria | 95.7 /100 | #98 | Exceptional 29.4% |
| Immigrants | Denmark | 95.3 /100 | #99 | Exceptional 29.4% |
| Luxembourgers | 95.2 /100 | #100 | Exceptional 29.4% |
| Immigrants | Northern Africa | 94.7 /100 | #101 | Exceptional 29.5% |
| Australians | 94.6 /100 | #102 | Exceptional 29.5% |
| Lebanese | 94.4 /100 | #103 | Exceptional 29.5% |
| Lithuanians | 94.4 /100 | #104 | Exceptional 29.6% |
| Immigrants | Nepal | 94.3 /100 | #105 | Exceptional 29.6% |
| Swedes | 93.8 /100 | #106 | Exceptional 29.6% |
| Immigrants | Brazil | 93.7 /100 | #107 | Exceptional 29.6% |
| Paraguayans | 93.5 /100 | #108 | Exceptional 29.7% |
| Greeks | 93.4 /100 | #109 | Exceptional 29.7% |
| Immigrants | Ethiopia | 93.4 /100 | #110 | Exceptional 29.7% |
Demographics Similar to Navajo by Births to Unmarried Women
In terms of births to unmarried women, the demographic groups most similar to Navajo are Pima (51.5%, a difference of 0.040%), Menominee (51.1%, a difference of 0.74%), Inupiat (52.1%, a difference of 1.2%), Hopi (50.8%, a difference of 1.3%), and Tohono O'odham (49.8%, a difference of 3.3%).
| Demographics | Rating | Rank | Births to Unmarried Women |
| Blacks/African Americans | 0.0 /100 | #333 | Tragic 44.3% |
| Yuman | 0.0 /100 | #334 | Tragic 44.4% |
| Colville | 0.0 /100 | #335 | Tragic 45.3% |
| Puerto Ricans | 0.0 /100 | #336 | Tragic 45.7% |
| Houma | 0.0 /100 | #337 | Tragic 46.6% |
| Arapaho | 0.0 /100 | #338 | Tragic 47.1% |
| Lumbee | 0.0 /100 | #339 | Tragic 48.2% |
| Tohono O'odham | 0.0 /100 | #340 | Tragic 49.8% |
| Hopi | 0.0 /100 | #341 | Tragic 50.8% |
| Menominee | 0.0 /100 | #342 | Tragic 51.1% |
| Pima | 0.0 /100 | #343 | Tragic 51.5% |
| Navajo | 0.0 /100 | #344 | Tragic 51.5% |
| Inupiat | 0.0 /100 | #345 | Tragic 52.1% |
| Pueblo | 0.0 /100 | #346 | Tragic 53.7% |
| Yup'ik | 0.0 /100 | #347 | Tragic 56.4% |