Honduran vs Jordanian Births to Unmarried Women
COMPARE
Honduran
Jordanian
Births to Unmarried Women
Births to Unmarried Women Comparison
Hondurans
Jordanians
38.7%
BIRTHS TO UNMARRIED WOMEN
0.0/ 100
METRIC RATING
302nd/ 347
METRIC RANK
28.5%
BIRTHS TO UNMARRIED WOMEN
98.5/ 100
METRIC RATING
71st/ 347
METRIC RANK
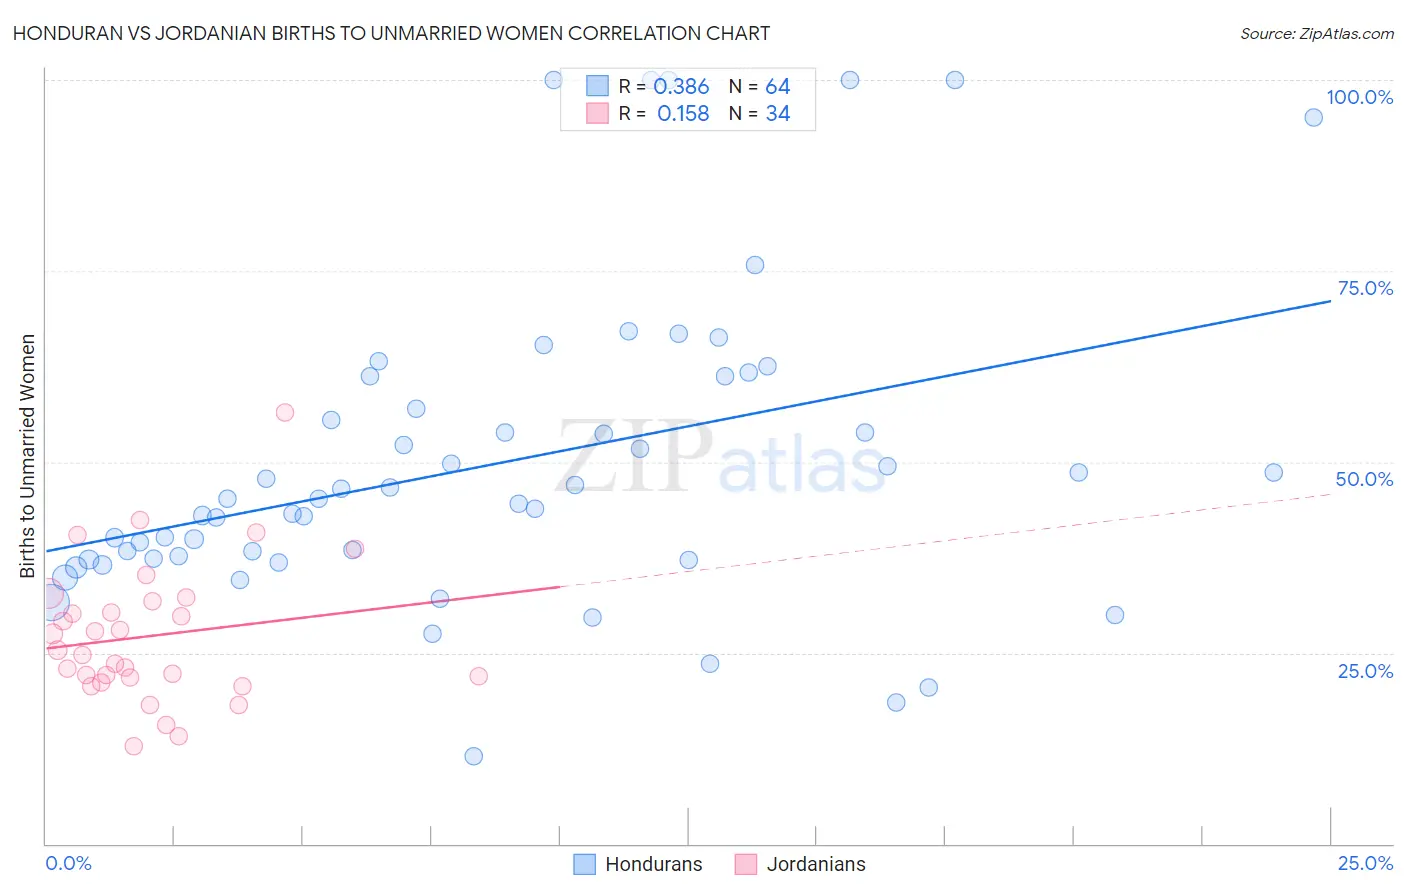
Honduran vs Jordanian Births to Unmarried Women Correlation Chart
The statistical analysis conducted on geographies consisting of 342,571,212 people shows a mild positive correlation between the proportion of Hondurans and percentage of births to unmarried women in the United States with a correlation coefficient (R) of 0.386 and weighted average of 38.7%. Similarly, the statistical analysis conducted on geographies consisting of 160,910,775 people shows a poor positive correlation between the proportion of Jordanians and percentage of births to unmarried women in the United States with a correlation coefficient (R) of 0.158 and weighted average of 28.5%, a difference of 35.6%.
Births to Unmarried Women Correlation Summary
| Measurement | Honduran | Jordanian |
| Minimum | 11.5% | 12.8% |
| Maximum | 100.0% | 56.4% |
| Range | 88.5% | 43.6% |
| Mean | 49.8% | 27.2% |
| Median | 45.2% | 25.0% |
| Interquartile 25% (IQ1) | 37.3% | 21.7% |
| Interquartile 75% (IQ3) | 59.0% | 31.7% |
| Interquartile Range (IQR) | 21.8% | 10.0% |
| Standard Deviation (Sample) | 20.3% | 9.1% |
| Standard Deviation (Population) | 20.1% | 9.0% |
Similar Demographics by Births to Unmarried Women
Demographics Similar to Hondurans by Births to Unmarried Women
In terms of births to unmarried women, the demographic groups most similar to Hondurans are Haitian (38.6%, a difference of 0.24%), Immigrants from West Indies (38.6%, a difference of 0.25%), Spanish American (38.6%, a difference of 0.31%), Immigrants from Jamaica (38.8%, a difference of 0.32%), and Yaqui (38.8%, a difference of 0.37%).
| Demographics | Rating | Rank | Births to Unmarried Women |
| Iroquois | 0.0 /100 | #295 | Tragic 38.2% |
| Alaska Natives | 0.0 /100 | #296 | Tragic 38.3% |
| Dutch West Indians | 0.0 /100 | #297 | Tragic 38.4% |
| Jamaicans | 0.0 /100 | #298 | Tragic 38.5% |
| Spanish Americans | 0.0 /100 | #299 | Tragic 38.6% |
| Immigrants | West Indies | 0.0 /100 | #300 | Tragic 38.6% |
| Haitians | 0.0 /100 | #301 | Tragic 38.6% |
| Hondurans | 0.0 /100 | #302 | Tragic 38.7% |
| Immigrants | Jamaica | 0.0 /100 | #303 | Tragic 38.8% |
| Yaqui | 0.0 /100 | #304 | Tragic 38.8% |
| Immigrants | Haiti | 0.0 /100 | #305 | Tragic 38.9% |
| Central American Indians | 0.0 /100 | #306 | Tragic 39.0% |
| Immigrants | Honduras | 0.0 /100 | #307 | Tragic 39.3% |
| Aleuts | 0.0 /100 | #308 | Tragic 39.3% |
| Cubans | 0.0 /100 | #309 | Tragic 39.4% |
Demographics Similar to Jordanians by Births to Unmarried Women
In terms of births to unmarried women, the demographic groups most similar to Jordanians are Immigrants from Sweden (28.5%, a difference of 0.060%), Albanian (28.5%, a difference of 0.11%), Immigrants from Bolivia (28.6%, a difference of 0.13%), Laotian (28.5%, a difference of 0.18%), and Immigrants from Switzerland (28.6%, a difference of 0.22%).
| Demographics | Rating | Rank | Births to Unmarried Women |
| Tongans | 98.8 /100 | #64 | Exceptional 28.4% |
| Immigrants | Czechoslovakia | 98.8 /100 | #65 | Exceptional 28.4% |
| Immigrants | Egypt | 98.8 /100 | #66 | Exceptional 28.4% |
| Palestinians | 98.7 /100 | #67 | Exceptional 28.4% |
| Immigrants | Europe | 98.7 /100 | #68 | Exceptional 28.4% |
| Bolivians | 98.7 /100 | #69 | Exceptional 28.5% |
| Laotians | 98.6 /100 | #70 | Exceptional 28.5% |
| Jordanians | 98.5 /100 | #71 | Exceptional 28.5% |
| Immigrants | Sweden | 98.5 /100 | #72 | Exceptional 28.5% |
| Albanians | 98.5 /100 | #73 | Exceptional 28.5% |
| Immigrants | Bolivia | 98.5 /100 | #74 | Exceptional 28.6% |
| Immigrants | Switzerland | 98.4 /100 | #75 | Exceptional 28.6% |
| Israelis | 98.4 /100 | #76 | Exceptional 28.6% |
| Immigrants | Northern Europe | 98.3 /100 | #77 | Exceptional 28.6% |
| Zimbabweans | 98.2 /100 | #78 | Exceptional 28.7% |