Immigrants from Italy vs Immigrants from Spain Births to Unmarried Women
COMPARE
Immigrants from Italy
Immigrants from Spain
Births to Unmarried Women
Births to Unmarried Women Comparison
Immigrants from Italy
Immigrants from Spain
29.9%
BIRTHS TO UNMARRIED WOMEN
91.7/ 100
METRIC RATING
116th/ 347
METRIC RANK
30.3%
BIRTHS TO UNMARRIED WOMEN
85.8/ 100
METRIC RATING
129th/ 347
METRIC RANK
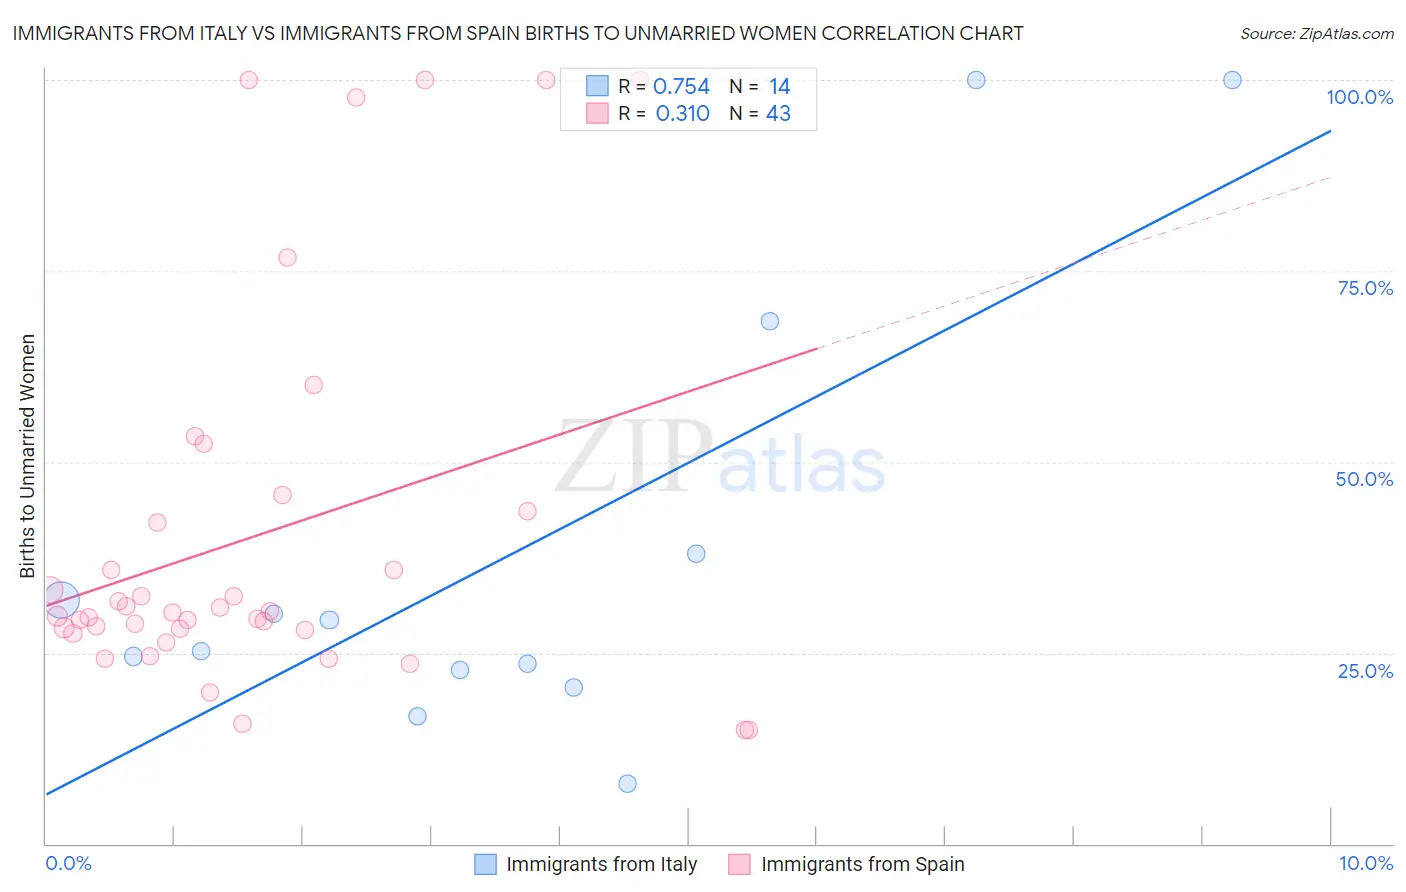
Immigrants from Italy vs Immigrants from Spain Births to Unmarried Women Correlation Chart
The statistical analysis conducted on geographies consisting of 300,581,400 people shows a strong positive correlation between the proportion of Immigrants from Italy and percentage of births to unmarried women in the United States with a correlation coefficient (R) of 0.754 and weighted average of 29.9%. Similarly, the statistical analysis conducted on geographies consisting of 227,898,948 people shows a mild positive correlation between the proportion of Immigrants from Spain and percentage of births to unmarried women in the United States with a correlation coefficient (R) of 0.310 and weighted average of 30.3%, a difference of 1.5%.
Births to Unmarried Women Correlation Summary
| Measurement | Immigrants from Italy | Immigrants from Spain |
| Minimum | 7.9% | 14.9% |
| Maximum | 100.0% | 100.0% |
| Range | 92.1% | 85.1% |
| Mean | 38.5% | 40.2% |
| Median | 27.2% | 30.3% |
| Interquartile 25% (IQ1) | 22.8% | 28.0% |
| Interquartile 75% (IQ3) | 38.0% | 43.6% |
| Interquartile Range (IQR) | 15.2% | 15.6% |
| Standard Deviation (Sample) | 29.4% | 24.6% |
| Standard Deviation (Population) | 28.3% | 24.3% |
Demographics Similar to Immigrants from Italy and Immigrants from Spain by Births to Unmarried Women
In terms of births to unmarried women, the demographic groups most similar to Immigrants from Italy are Ethiopian (29.8%, a difference of 0.080%), Immigrants from Netherlands (29.9%, a difference of 0.21%), Immigrants from Norway (29.9%, a difference of 0.23%), Immigrants from Croatia (29.8%, a difference of 0.30%), and Scandinavian (29.8%, a difference of 0.36%). Similarly, the demographic groups most similar to Immigrants from Spain are Immigrants from Bosnia and Herzegovina (30.3%, a difference of 0.010%), Immigrants from Zimbabwe (30.3%, a difference of 0.020%), Icelander (30.3%, a difference of 0.040%), New Zealander (30.3%, a difference of 0.060%), and Chinese (30.2%, a difference of 0.28%).
| Demographics | Rating | Rank | Births to Unmarried Women |
| Basques | 93.0 /100 | #112 | Exceptional 29.7% |
| Scandinavians | 92.7 /100 | #113 | Exceptional 29.8% |
| Immigrants | Croatia | 92.6 /100 | #114 | Exceptional 29.8% |
| Ethiopians | 91.9 /100 | #115 | Exceptional 29.8% |
| Immigrants | Italy | 91.7 /100 | #116 | Exceptional 29.9% |
| Immigrants | Netherlands | 91.1 /100 | #117 | Exceptional 29.9% |
| Immigrants | Norway | 91.0 /100 | #118 | Exceptional 29.9% |
| Argentineans | 90.5 /100 | #119 | Exceptional 30.0% |
| Ugandans | 89.2 /100 | #120 | Excellent 30.1% |
| Koreans | 88.9 /100 | #121 | Excellent 30.1% |
| Immigrants | Argentina | 88.7 /100 | #122 | Excellent 30.1% |
| Syrians | 88.2 /100 | #123 | Excellent 30.2% |
| Croatians | 88.0 /100 | #124 | Excellent 30.2% |
| Vietnamese | 87.7 /100 | #125 | Excellent 30.2% |
| Europeans | 87.2 /100 | #126 | Excellent 30.2% |
| Chinese | 87.1 /100 | #127 | Excellent 30.2% |
| Icelanders | 86.0 /100 | #128 | Excellent 30.3% |
| Immigrants | Spain | 85.8 /100 | #129 | Excellent 30.3% |
| Immigrants | Bosnia and Herzegovina | 85.7 /100 | #130 | Excellent 30.3% |
| Immigrants | Zimbabwe | 85.7 /100 | #131 | Excellent 30.3% |
| New Zealanders | 85.5 /100 | #132 | Excellent 30.3% |