Colville vs Immigrants from Jordan Currently Married
COMPARE
Colville
Immigrants from Jordan
Currently Married
Currently Married Comparison
Colville
Immigrants from Jordan
43.4%
CURRENTLY MARRIED
0.1/ 100
METRIC RATING
275th/ 347
METRIC RANK
47.4%
CURRENTLY MARRIED
84.9/ 100
METRIC RATING
126th/ 347
METRIC RANK
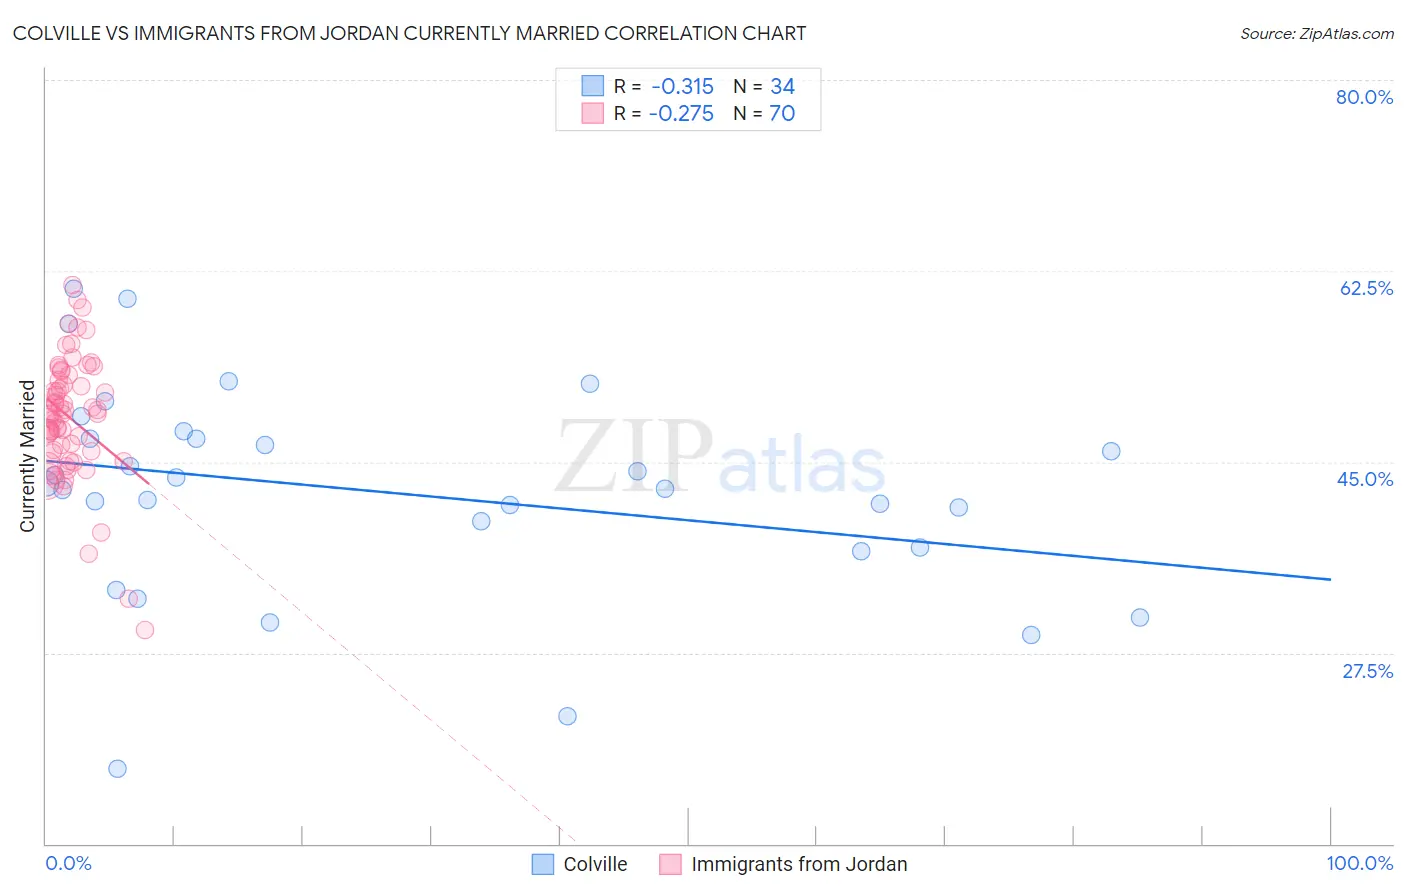
Colville vs Immigrants from Jordan Currently Married Correlation Chart
The statistical analysis conducted on geographies consisting of 34,682,856 people shows a mild negative correlation between the proportion of Colville and percentage of population currently married in the United States with a correlation coefficient (R) of -0.315 and weighted average of 43.4%. Similarly, the statistical analysis conducted on geographies consisting of 181,237,852 people shows a weak negative correlation between the proportion of Immigrants from Jordan and percentage of population currently married in the United States with a correlation coefficient (R) of -0.275 and weighted average of 47.4%, a difference of 9.1%.
Currently Married Correlation Summary
| Measurement | Colville | Immigrants from Jordan |
| Minimum | 16.9% | 29.6% |
| Maximum | 60.9% | 61.2% |
| Range | 44.0% | 31.6% |
| Mean | 42.2% | 49.1% |
| Median | 42.8% | 49.4% |
| Interquartile 25% (IQ1) | 37.2% | 46.0% |
| Interquartile 75% (IQ3) | 47.1% | 52.5% |
| Interquartile Range (IQR) | 9.9% | 6.5% |
| Standard Deviation (Sample) | 9.7% | 5.7% |
| Standard Deviation (Population) | 9.5% | 5.6% |
Similar Demographics by Currently Married
Demographics Similar to Colville by Currently Married
In terms of currently married, the demographic groups most similar to Colville are Nigerian (43.4%, a difference of 0.020%), Sierra Leonean (43.4%, a difference of 0.030%), Yaqui (43.4%, a difference of 0.040%), Immigrants from Nigeria (43.4%, a difference of 0.040%), and Indonesian (43.5%, a difference of 0.080%).
| Demographics | Rating | Rank | Currently Married |
| Spanish American Indians | 0.1 /100 | #268 | Tragic 43.6% |
| Immigrants | Sudan | 0.1 /100 | #269 | Tragic 43.5% |
| Salvadorans | 0.1 /100 | #270 | Tragic 43.5% |
| Bermudans | 0.1 /100 | #271 | Tragic 43.5% |
| Indonesians | 0.1 /100 | #272 | Tragic 43.5% |
| Yaqui | 0.1 /100 | #273 | Tragic 43.4% |
| Nigerians | 0.1 /100 | #274 | Tragic 43.4% |
| Colville | 0.1 /100 | #275 | Tragic 43.4% |
| Sierra Leoneans | 0.1 /100 | #276 | Tragic 43.4% |
| Immigrants | Nigeria | 0.1 /100 | #277 | Tragic 43.4% |
| Central Americans | 0.0 /100 | #278 | Tragic 43.3% |
| Central American Indians | 0.0 /100 | #279 | Tragic 43.3% |
| Apache | 0.0 /100 | #280 | Tragic 43.2% |
| Chippewa | 0.0 /100 | #281 | Tragic 43.2% |
| Immigrants | Ecuador | 0.0 /100 | #282 | Tragic 43.2% |
Demographics Similar to Immigrants from Jordan by Currently Married
In terms of currently married, the demographic groups most similar to Immigrants from Jordan are New Zealander (47.4%, a difference of 0.0%), Okinawan (47.4%, a difference of 0.030%), Portuguese (47.3%, a difference of 0.050%), Sri Lankan (47.3%, a difference of 0.11%), and Laotian (47.4%, a difference of 0.13%).
| Demographics | Rating | Rank | Currently Married |
| Australians | 90.2 /100 | #119 | Exceptional 47.6% |
| Syrians | 88.9 /100 | #120 | Excellent 47.5% |
| Immigrants | Croatia | 88.6 /100 | #121 | Excellent 47.5% |
| Osage | 87.9 /100 | #122 | Excellent 47.5% |
| Immigrants | Kazakhstan | 87.2 /100 | #123 | Excellent 47.4% |
| Laotians | 86.6 /100 | #124 | Excellent 47.4% |
| Okinawans | 85.3 /100 | #125 | Excellent 47.4% |
| Immigrants | Jordan | 84.9 /100 | #126 | Excellent 47.4% |
| New Zealanders | 84.9 /100 | #127 | Excellent 47.4% |
| Portuguese | 84.2 /100 | #128 | Excellent 47.3% |
| Sri Lankans | 83.2 /100 | #129 | Excellent 47.3% |
| Immigrants | Iraq | 82.8 /100 | #130 | Excellent 47.3% |
| Icelanders | 82.4 /100 | #131 | Excellent 47.3% |
| Afghans | 81.8 /100 | #132 | Excellent 47.3% |
| Immigrants | Malaysia | 81.1 /100 | #133 | Excellent 47.3% |