Bangladeshi vs Immigrants from Jordan Currently Married
COMPARE
Bangladeshi
Immigrants from Jordan
Currently Married
Currently Married Comparison
Bangladeshis
Immigrants from Jordan
43.7%
CURRENTLY MARRIED
0.1/ 100
METRIC RATING
262nd/ 347
METRIC RANK
47.4%
CURRENTLY MARRIED
84.9/ 100
METRIC RATING
126th/ 347
METRIC RANK
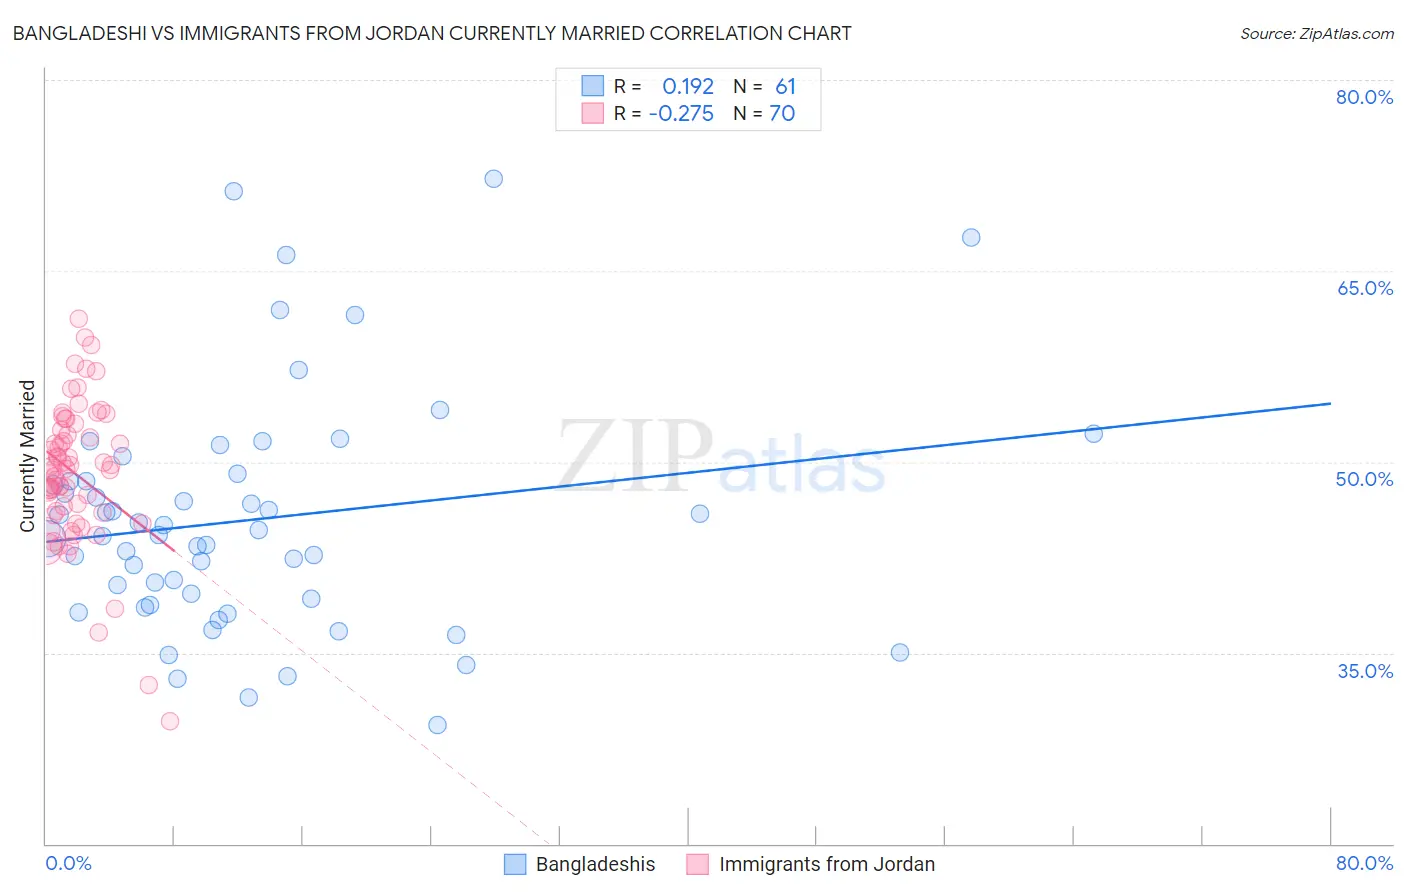
Bangladeshi vs Immigrants from Jordan Currently Married Correlation Chart
The statistical analysis conducted on geographies consisting of 141,443,352 people shows a poor positive correlation between the proportion of Bangladeshis and percentage of population currently married in the United States with a correlation coefficient (R) of 0.192 and weighted average of 43.7%. Similarly, the statistical analysis conducted on geographies consisting of 181,237,852 people shows a weak negative correlation between the proportion of Immigrants from Jordan and percentage of population currently married in the United States with a correlation coefficient (R) of -0.275 and weighted average of 47.4%, a difference of 8.4%.
Currently Married Correlation Summary
| Measurement | Bangladeshi | Immigrants from Jordan |
| Minimum | 29.3% | 29.6% |
| Maximum | 72.2% | 61.2% |
| Range | 42.9% | 31.6% |
| Mean | 45.5% | 49.1% |
| Median | 44.3% | 49.4% |
| Interquartile 25% (IQ1) | 39.0% | 46.0% |
| Interquartile 75% (IQ3) | 48.8% | 52.5% |
| Interquartile Range (IQR) | 9.8% | 6.5% |
| Standard Deviation (Sample) | 9.3% | 5.7% |
| Standard Deviation (Population) | 9.2% | 5.6% |
Similar Demographics by Currently Married
Demographics Similar to Bangladeshis by Currently Married
In terms of currently married, the demographic groups most similar to Bangladeshis are Immigrants from Cuba (43.7%, a difference of 0.040%), Sudanese (43.7%, a difference of 0.050%), Immigrants from Nicaragua (43.7%, a difference of 0.14%), Immigrants from Bangladesh (43.6%, a difference of 0.14%), and Immigrants from Latin America (43.8%, a difference of 0.18%).
| Demographics | Rating | Rank | Currently Married |
| Yakama | 0.2 /100 | #255 | Tragic 44.0% |
| Shoshone | 0.2 /100 | #256 | Tragic 44.0% |
| Immigrants | Africa | 0.2 /100 | #257 | Tragic 43.9% |
| Ute | 0.2 /100 | #258 | Tragic 43.9% |
| Immigrants | Sierra Leone | 0.1 /100 | #259 | Tragic 43.8% |
| Immigrants | Latin America | 0.1 /100 | #260 | Tragic 43.8% |
| Immigrants | Nicaragua | 0.1 /100 | #261 | Tragic 43.7% |
| Bangladeshis | 0.1 /100 | #262 | Tragic 43.7% |
| Immigrants | Cuba | 0.1 /100 | #263 | Tragic 43.7% |
| Sudanese | 0.1 /100 | #264 | Tragic 43.7% |
| Immigrants | Bangladesh | 0.1 /100 | #265 | Tragic 43.6% |
| Ecuadorians | 0.1 /100 | #266 | Tragic 43.6% |
| Immigrants | Eritrea | 0.1 /100 | #267 | Tragic 43.6% |
| Spanish American Indians | 0.1 /100 | #268 | Tragic 43.6% |
| Immigrants | Sudan | 0.1 /100 | #269 | Tragic 43.5% |
Demographics Similar to Immigrants from Jordan by Currently Married
In terms of currently married, the demographic groups most similar to Immigrants from Jordan are New Zealander (47.4%, a difference of 0.0%), Okinawan (47.4%, a difference of 0.030%), Portuguese (47.3%, a difference of 0.050%), Sri Lankan (47.3%, a difference of 0.11%), and Laotian (47.4%, a difference of 0.13%).
| Demographics | Rating | Rank | Currently Married |
| Australians | 90.2 /100 | #119 | Exceptional 47.6% |
| Syrians | 88.9 /100 | #120 | Excellent 47.5% |
| Immigrants | Croatia | 88.6 /100 | #121 | Excellent 47.5% |
| Osage | 87.9 /100 | #122 | Excellent 47.5% |
| Immigrants | Kazakhstan | 87.2 /100 | #123 | Excellent 47.4% |
| Laotians | 86.6 /100 | #124 | Excellent 47.4% |
| Okinawans | 85.3 /100 | #125 | Excellent 47.4% |
| Immigrants | Jordan | 84.9 /100 | #126 | Excellent 47.4% |
| New Zealanders | 84.9 /100 | #127 | Excellent 47.4% |
| Portuguese | 84.2 /100 | #128 | Excellent 47.3% |
| Sri Lankans | 83.2 /100 | #129 | Excellent 47.3% |
| Immigrants | Iraq | 82.8 /100 | #130 | Excellent 47.3% |
| Icelanders | 82.4 /100 | #131 | Excellent 47.3% |
| Afghans | 81.8 /100 | #132 | Excellent 47.3% |
| Immigrants | Malaysia | 81.1 /100 | #133 | Excellent 47.3% |