Paiute vs Immigrants from Jordan Currently Married
COMPARE
Paiute
Immigrants from Jordan
Currently Married
Currently Married Comparison
Paiute
Immigrants from Jordan
42.7%
CURRENTLY MARRIED
0.0/ 100
METRIC RATING
289th/ 347
METRIC RANK
47.4%
CURRENTLY MARRIED
84.9/ 100
METRIC RATING
126th/ 347
METRIC RANK
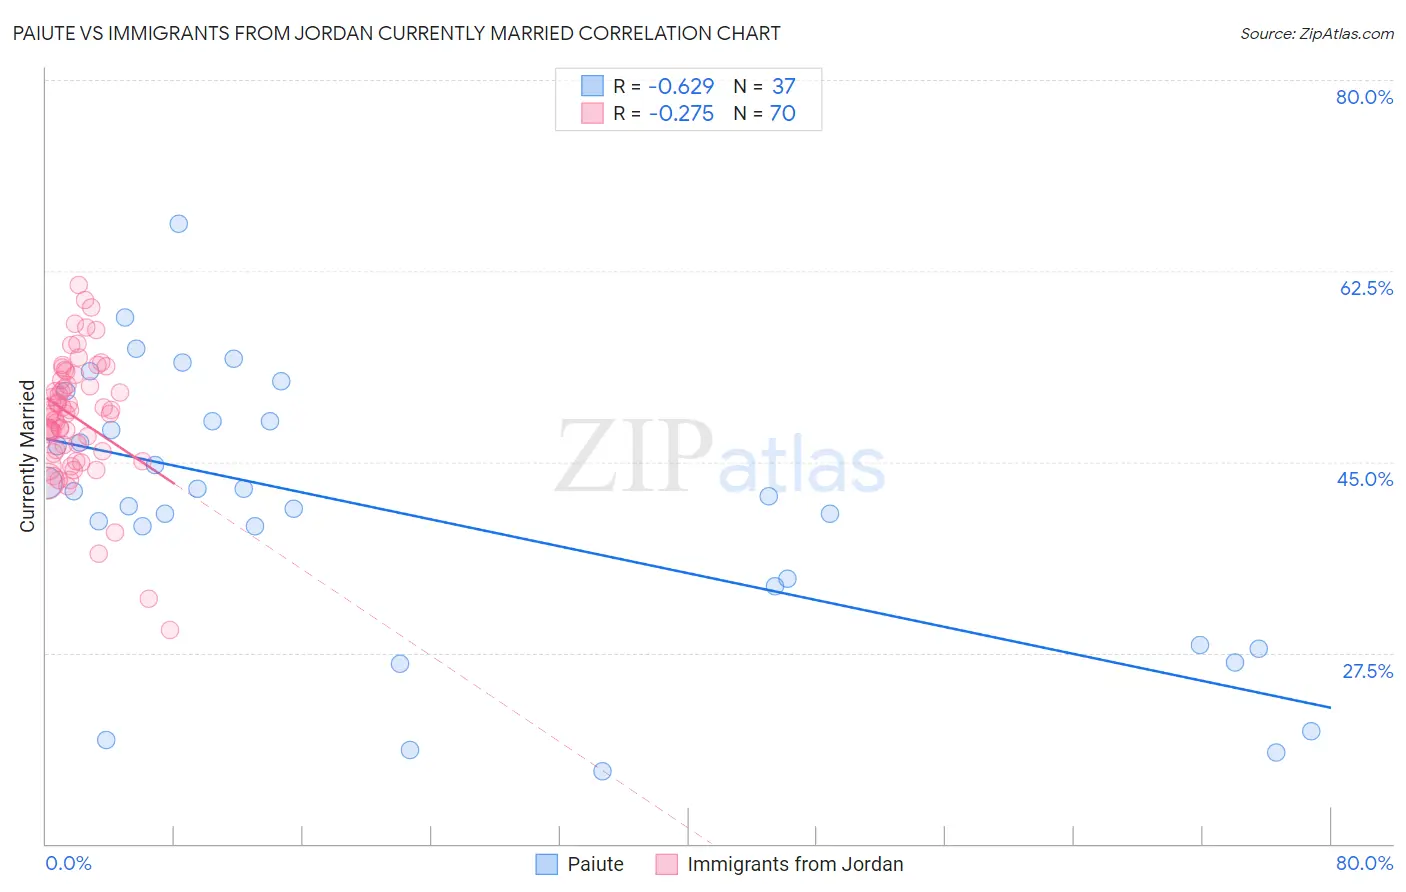
Paiute vs Immigrants from Jordan Currently Married Correlation Chart
The statistical analysis conducted on geographies consisting of 58,403,675 people shows a significant negative correlation between the proportion of Paiute and percentage of population currently married in the United States with a correlation coefficient (R) of -0.629 and weighted average of 42.7%. Similarly, the statistical analysis conducted on geographies consisting of 181,237,852 people shows a weak negative correlation between the proportion of Immigrants from Jordan and percentage of population currently married in the United States with a correlation coefficient (R) of -0.275 and weighted average of 47.4%, a difference of 10.9%.
Currently Married Correlation Summary
| Measurement | Paiute | Immigrants from Jordan |
| Minimum | 16.6% | 29.6% |
| Maximum | 66.9% | 61.2% |
| Range | 50.3% | 31.6% |
| Mean | 40.3% | 49.1% |
| Median | 41.9% | 49.4% |
| Interquartile 25% (IQ1) | 30.9% | 46.0% |
| Interquartile 75% (IQ3) | 48.7% | 52.5% |
| Interquartile Range (IQR) | 17.8% | 6.5% |
| Standard Deviation (Sample) | 12.4% | 5.7% |
| Standard Deviation (Population) | 12.2% | 5.6% |
Similar Demographics by Currently Married
Demographics Similar to Paiute by Currently Married
In terms of currently married, the demographic groups most similar to Paiute are Immigrants from Ghana (42.7%, a difference of 0.010%), Immigrants from Guatemala (42.6%, a difference of 0.12%), Native/Alaskan (42.8%, a difference of 0.23%), Subsaharan African (42.6%, a difference of 0.28%), and Yuman (42.6%, a difference of 0.30%).
| Demographics | Rating | Rank | Currently Married |
| Immigrants | Ecuador | 0.0 /100 | #282 | Tragic 43.2% |
| Kiowa | 0.0 /100 | #283 | Tragic 43.2% |
| Immigrants | El Salvador | 0.0 /100 | #284 | Tragic 43.1% |
| Immigrants | Middle Africa | 0.0 /100 | #285 | Tragic 43.0% |
| Ghanaians | 0.0 /100 | #286 | Tragic 42.9% |
| Guatemalans | 0.0 /100 | #287 | Tragic 42.9% |
| Natives/Alaskans | 0.0 /100 | #288 | Tragic 42.8% |
| Paiute | 0.0 /100 | #289 | Tragic 42.7% |
| Immigrants | Ghana | 0.0 /100 | #290 | Tragic 42.7% |
| Immigrants | Guatemala | 0.0 /100 | #291 | Tragic 42.6% |
| Sub-Saharan Africans | 0.0 /100 | #292 | Tragic 42.6% |
| Yuman | 0.0 /100 | #293 | Tragic 42.6% |
| Hondurans | 0.0 /100 | #294 | Tragic 42.5% |
| Immigrants | Western Africa | 0.0 /100 | #295 | Tragic 42.4% |
| Menominee | 0.0 /100 | #296 | Tragic 42.3% |
Demographics Similar to Immigrants from Jordan by Currently Married
In terms of currently married, the demographic groups most similar to Immigrants from Jordan are New Zealander (47.4%, a difference of 0.0%), Okinawan (47.4%, a difference of 0.030%), Portuguese (47.3%, a difference of 0.050%), Sri Lankan (47.3%, a difference of 0.11%), and Laotian (47.4%, a difference of 0.13%).
| Demographics | Rating | Rank | Currently Married |
| Australians | 90.2 /100 | #119 | Exceptional 47.6% |
| Syrians | 88.9 /100 | #120 | Excellent 47.5% |
| Immigrants | Croatia | 88.6 /100 | #121 | Excellent 47.5% |
| Osage | 87.9 /100 | #122 | Excellent 47.5% |
| Immigrants | Kazakhstan | 87.2 /100 | #123 | Excellent 47.4% |
| Laotians | 86.6 /100 | #124 | Excellent 47.4% |
| Okinawans | 85.3 /100 | #125 | Excellent 47.4% |
| Immigrants | Jordan | 84.9 /100 | #126 | Excellent 47.4% |
| New Zealanders | 84.9 /100 | #127 | Excellent 47.4% |
| Portuguese | 84.2 /100 | #128 | Excellent 47.3% |
| Sri Lankans | 83.2 /100 | #129 | Excellent 47.3% |
| Immigrants | Iraq | 82.8 /100 | #130 | Excellent 47.3% |
| Icelanders | 82.4 /100 | #131 | Excellent 47.3% |
| Afghans | 81.8 /100 | #132 | Excellent 47.3% |
| Immigrants | Malaysia | 81.1 /100 | #133 | Excellent 47.3% |