Lebanese vs Immigrants from Jordan Currently Married
COMPARE
Lebanese
Immigrants from Jordan
Currently Married
Currently Married Comparison
Lebanese
Immigrants from Jordan
47.9%
CURRENTLY MARRIED
95.1/ 100
METRIC RATING
93rd/ 347
METRIC RANK
47.4%
CURRENTLY MARRIED
84.9/ 100
METRIC RATING
126th/ 347
METRIC RANK
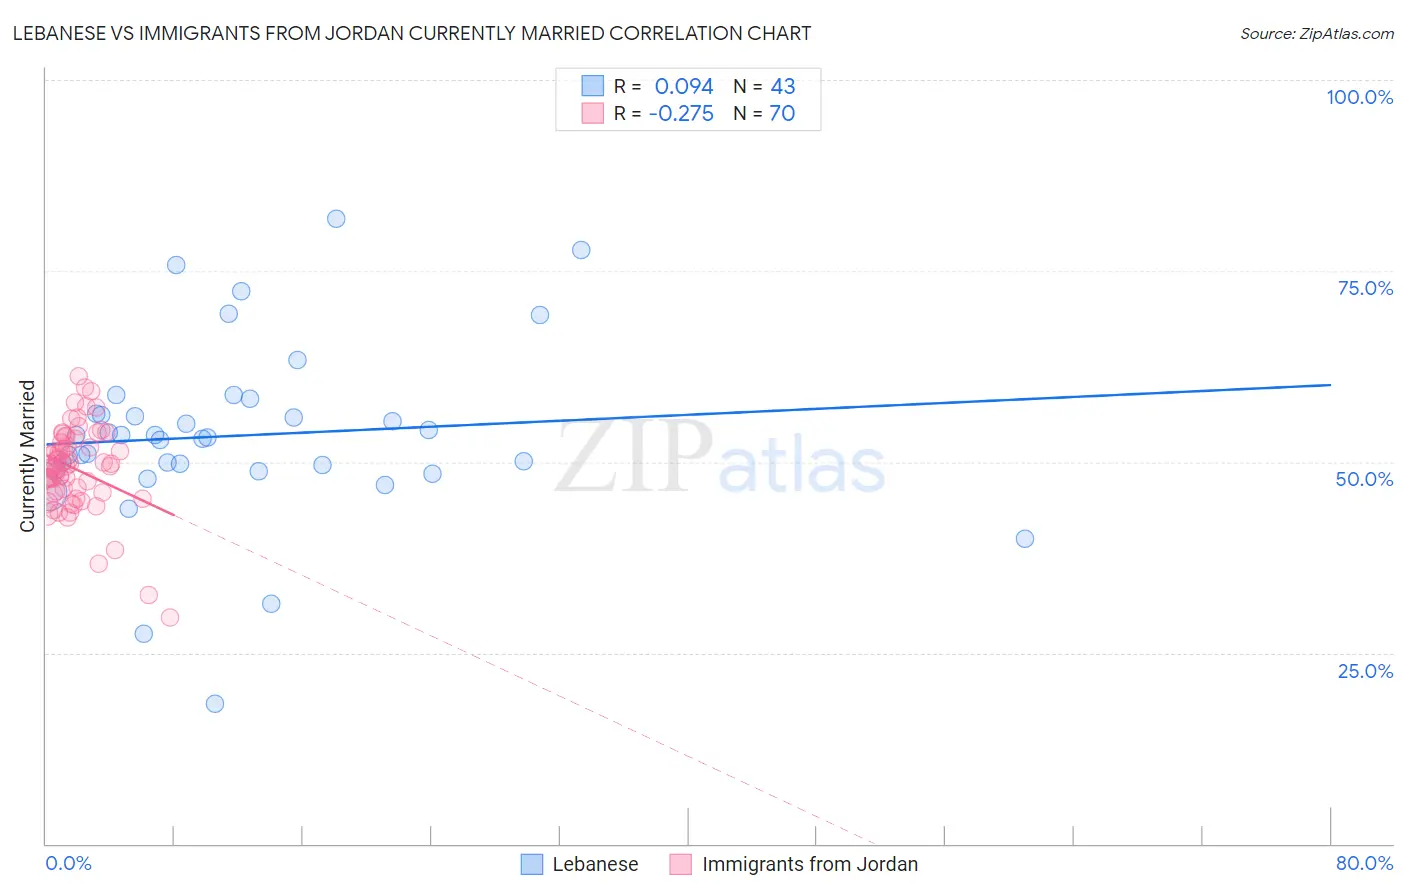
Lebanese vs Immigrants from Jordan Currently Married Correlation Chart
The statistical analysis conducted on geographies consisting of 401,555,158 people shows a slight positive correlation between the proportion of Lebanese and percentage of population currently married in the United States with a correlation coefficient (R) of 0.094 and weighted average of 47.9%. Similarly, the statistical analysis conducted on geographies consisting of 181,237,852 people shows a weak negative correlation between the proportion of Immigrants from Jordan and percentage of population currently married in the United States with a correlation coefficient (R) of -0.275 and weighted average of 47.4%, a difference of 1.1%.
Currently Married Correlation Summary
| Measurement | Lebanese | Immigrants from Jordan |
| Minimum | 18.3% | 29.6% |
| Maximum | 81.9% | 61.2% |
| Range | 63.6% | 31.6% |
| Mean | 53.4% | 49.1% |
| Median | 53.2% | 49.4% |
| Interquartile 25% (IQ1) | 49.1% | 46.0% |
| Interquartile 75% (IQ3) | 56.3% | 52.5% |
| Interquartile Range (IQR) | 7.3% | 6.5% |
| Standard Deviation (Sample) | 11.9% | 5.7% |
| Standard Deviation (Population) | 11.7% | 5.6% |
Similar Demographics by Currently Married
Demographics Similar to Lebanese by Currently Married
In terms of currently married, the demographic groups most similar to Lebanese are Native Hawaiian (47.9%, a difference of 0.010%), Korean (47.9%, a difference of 0.050%), Immigrants from Bulgaria (47.9%, a difference of 0.050%), Egyptian (47.9%, a difference of 0.050%), and Immigrants from Ukraine (47.9%, a difference of 0.060%).
| Demographics | Rating | Rank | Currently Married |
| Immigrants | Japan | 96.2 /100 | #86 | Exceptional 48.0% |
| Jordanians | 96.2 /100 | #87 | Exceptional 48.0% |
| Immigrants | Eastern Europe | 96.1 /100 | #88 | Exceptional 48.0% |
| Indians (Asian) | 95.8 /100 | #89 | Exceptional 48.0% |
| Americans | 95.7 /100 | #90 | Exceptional 48.0% |
| Immigrants | Bolivia | 95.6 /100 | #91 | Exceptional 47.9% |
| Koreans | 95.4 /100 | #92 | Exceptional 47.9% |
| Lebanese | 95.1 /100 | #93 | Exceptional 47.9% |
| Native Hawaiians | 95.0 /100 | #94 | Exceptional 47.9% |
| Immigrants | Bulgaria | 94.8 /100 | #95 | Exceptional 47.9% |
| Egyptians | 94.8 /100 | #96 | Exceptional 47.9% |
| Immigrants | Ukraine | 94.8 /100 | #97 | Exceptional 47.9% |
| Immigrants | China | 94.7 /100 | #98 | Exceptional 47.9% |
| Immigrants | Sweden | 94.3 /100 | #99 | Exceptional 47.8% |
| Celtics | 94.2 /100 | #100 | Exceptional 47.8% |
Demographics Similar to Immigrants from Jordan by Currently Married
In terms of currently married, the demographic groups most similar to Immigrants from Jordan are New Zealander (47.4%, a difference of 0.0%), Okinawan (47.4%, a difference of 0.030%), Portuguese (47.3%, a difference of 0.050%), Sri Lankan (47.3%, a difference of 0.11%), and Laotian (47.4%, a difference of 0.13%).
| Demographics | Rating | Rank | Currently Married |
| Australians | 90.2 /100 | #119 | Exceptional 47.6% |
| Syrians | 88.9 /100 | #120 | Excellent 47.5% |
| Immigrants | Croatia | 88.6 /100 | #121 | Excellent 47.5% |
| Osage | 87.9 /100 | #122 | Excellent 47.5% |
| Immigrants | Kazakhstan | 87.2 /100 | #123 | Excellent 47.4% |
| Laotians | 86.6 /100 | #124 | Excellent 47.4% |
| Okinawans | 85.3 /100 | #125 | Excellent 47.4% |
| Immigrants | Jordan | 84.9 /100 | #126 | Excellent 47.4% |
| New Zealanders | 84.9 /100 | #127 | Excellent 47.4% |
| Portuguese | 84.2 /100 | #128 | Excellent 47.3% |
| Sri Lankans | 83.2 /100 | #129 | Excellent 47.3% |
| Immigrants | Iraq | 82.8 /100 | #130 | Excellent 47.3% |
| Icelanders | 82.4 /100 | #131 | Excellent 47.3% |
| Afghans | 81.8 /100 | #132 | Excellent 47.3% |
| Immigrants | Malaysia | 81.1 /100 | #133 | Excellent 47.3% |