Haitian vs Immigrants from Guatemala Currently Married
COMPARE
Haitian
Immigrants from Guatemala
Currently Married
Currently Married Comparison
Haitians
Immigrants from Guatemala
41.3%
CURRENTLY MARRIED
0.0/ 100
METRIC RATING
317th/ 347
METRIC RANK
42.6%
CURRENTLY MARRIED
0.0/ 100
METRIC RATING
291st/ 347
METRIC RANK
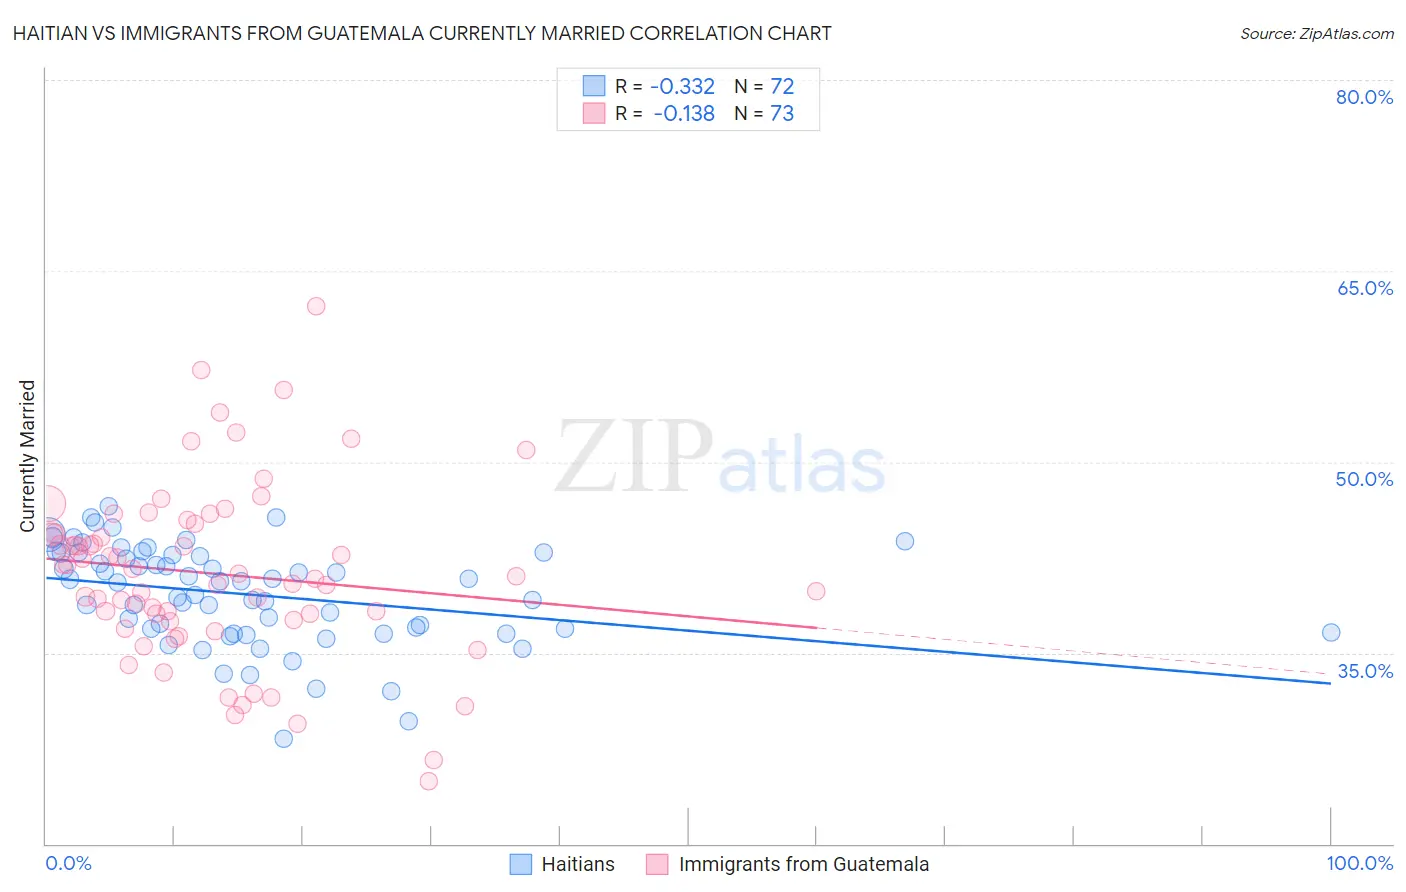
Haitian vs Immigrants from Guatemala Currently Married Correlation Chart
The statistical analysis conducted on geographies consisting of 287,965,636 people shows a mild negative correlation between the proportion of Haitians and percentage of population currently married in the United States with a correlation coefficient (R) of -0.332 and weighted average of 41.3%. Similarly, the statistical analysis conducted on geographies consisting of 377,254,434 people shows a poor negative correlation between the proportion of Immigrants from Guatemala and percentage of population currently married in the United States with a correlation coefficient (R) of -0.138 and weighted average of 42.6%, a difference of 3.4%.
Currently Married Correlation Summary
| Measurement | Haitian | Immigrants from Guatemala |
| Minimum | 28.3% | 24.9% |
| Maximum | 46.5% | 62.2% |
| Range | 18.2% | 37.3% |
| Mean | 39.6% | 41.2% |
| Median | 40.6% | 41.0% |
| Interquartile 25% (IQ1) | 36.7% | 37.6% |
| Interquartile 75% (IQ3) | 42.8% | 44.7% |
| Interquartile Range (IQR) | 6.1% | 7.1% |
| Standard Deviation (Sample) | 3.9% | 6.9% |
| Standard Deviation (Population) | 3.9% | 6.9% |
Similar Demographics by Currently Married
Demographics Similar to Haitians by Currently Married
In terms of currently married, the demographic groups most similar to Haitians are Immigrants from Caribbean (41.3%, a difference of 0.020%), Inupiat (41.3%, a difference of 0.080%), West Indian (41.3%, a difference of 0.17%), Bahamian (41.2%, a difference of 0.18%), and Immigrants from Somalia (41.2%, a difference of 0.20%).
| Demographics | Rating | Rank | Currently Married |
| Guyanese | 0.0 /100 | #310 | Tragic 41.6% |
| Trinidadians and Tobagonians | 0.0 /100 | #311 | Tragic 41.5% |
| Somalis | 0.0 /100 | #312 | Tragic 41.5% |
| Jamaicans | 0.0 /100 | #313 | Tragic 41.4% |
| West Indians | 0.0 /100 | #314 | Tragic 41.3% |
| Inupiat | 0.0 /100 | #315 | Tragic 41.3% |
| Immigrants | Caribbean | 0.0 /100 | #316 | Tragic 41.3% |
| Haitians | 0.0 /100 | #317 | Tragic 41.3% |
| Bahamians | 0.0 /100 | #318 | Tragic 41.2% |
| Immigrants | Somalia | 0.0 /100 | #319 | Tragic 41.2% |
| Immigrants | Jamaica | 0.0 /100 | #320 | Tragic 41.1% |
| Immigrants | Congo | 0.0 /100 | #321 | Tragic 41.1% |
| Immigrants | Haiti | 0.0 /100 | #322 | Tragic 41.0% |
| Immigrants | West Indies | 0.0 /100 | #323 | Tragic 40.7% |
| Immigrants | Senegal | 0.0 /100 | #324 | Tragic 40.7% |
Demographics Similar to Immigrants from Guatemala by Currently Married
In terms of currently married, the demographic groups most similar to Immigrants from Guatemala are Paiute (42.7%, a difference of 0.12%), Immigrants from Ghana (42.7%, a difference of 0.12%), Subsaharan African (42.6%, a difference of 0.16%), Yuman (42.6%, a difference of 0.18%), and Honduran (42.5%, a difference of 0.30%).
| Demographics | Rating | Rank | Currently Married |
| Immigrants | El Salvador | 0.0 /100 | #284 | Tragic 43.1% |
| Immigrants | Middle Africa | 0.0 /100 | #285 | Tragic 43.0% |
| Ghanaians | 0.0 /100 | #286 | Tragic 42.9% |
| Guatemalans | 0.0 /100 | #287 | Tragic 42.9% |
| Natives/Alaskans | 0.0 /100 | #288 | Tragic 42.8% |
| Paiute | 0.0 /100 | #289 | Tragic 42.7% |
| Immigrants | Ghana | 0.0 /100 | #290 | Tragic 42.7% |
| Immigrants | Guatemala | 0.0 /100 | #291 | Tragic 42.6% |
| Sub-Saharan Africans | 0.0 /100 | #292 | Tragic 42.6% |
| Yuman | 0.0 /100 | #293 | Tragic 42.6% |
| Hondurans | 0.0 /100 | #294 | Tragic 42.5% |
| Immigrants | Western Africa | 0.0 /100 | #295 | Tragic 42.4% |
| Menominee | 0.0 /100 | #296 | Tragic 42.3% |
| Cheyenne | 0.0 /100 | #297 | Tragic 42.2% |
| Immigrants | Honduras | 0.0 /100 | #298 | Tragic 42.2% |