Haitian vs Spanish American Indian Currently Married
COMPARE
Haitian
Spanish American Indian
Currently Married
Currently Married Comparison
Haitians
Spanish American Indians
41.3%
CURRENTLY MARRIED
0.0/ 100
METRIC RATING
317th/ 347
METRIC RANK
43.6%
CURRENTLY MARRIED
0.1/ 100
METRIC RATING
268th/ 347
METRIC RANK
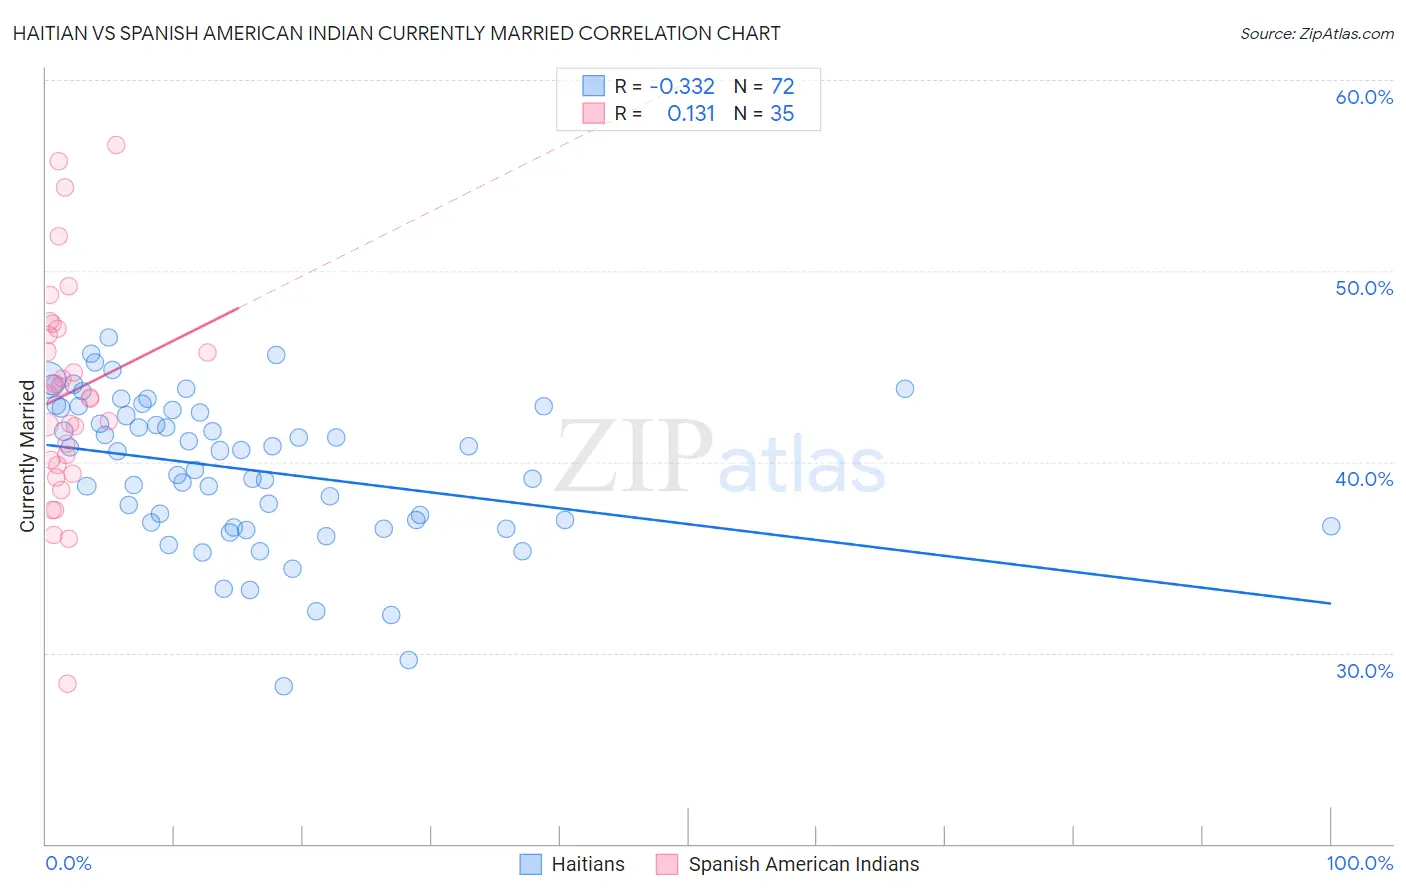
Haitian vs Spanish American Indian Currently Married Correlation Chart
The statistical analysis conducted on geographies consisting of 287,965,636 people shows a mild negative correlation between the proportion of Haitians and percentage of population currently married in the United States with a correlation coefficient (R) of -0.332 and weighted average of 41.3%. Similarly, the statistical analysis conducted on geographies consisting of 73,150,359 people shows a poor positive correlation between the proportion of Spanish American Indians and percentage of population currently married in the United States with a correlation coefficient (R) of 0.131 and weighted average of 43.6%, a difference of 5.6%.
Currently Married Correlation Summary
| Measurement | Haitian | Spanish American Indian |
| Minimum | 28.3% | 28.4% |
| Maximum | 46.5% | 56.6% |
| Range | 18.2% | 28.2% |
| Mean | 39.6% | 43.6% |
| Median | 40.6% | 43.4% |
| Interquartile 25% (IQ1) | 36.7% | 39.8% |
| Interquartile 75% (IQ3) | 42.8% | 47.0% |
| Interquartile Range (IQR) | 6.1% | 7.2% |
| Standard Deviation (Sample) | 3.9% | 5.8% |
| Standard Deviation (Population) | 3.9% | 5.7% |
Similar Demographics by Currently Married
Demographics Similar to Haitians by Currently Married
In terms of currently married, the demographic groups most similar to Haitians are Immigrants from Caribbean (41.3%, a difference of 0.020%), Inupiat (41.3%, a difference of 0.080%), West Indian (41.3%, a difference of 0.17%), Bahamian (41.2%, a difference of 0.18%), and Immigrants from Somalia (41.2%, a difference of 0.20%).
| Demographics | Rating | Rank | Currently Married |
| Guyanese | 0.0 /100 | #310 | Tragic 41.6% |
| Trinidadians and Tobagonians | 0.0 /100 | #311 | Tragic 41.5% |
| Somalis | 0.0 /100 | #312 | Tragic 41.5% |
| Jamaicans | 0.0 /100 | #313 | Tragic 41.4% |
| West Indians | 0.0 /100 | #314 | Tragic 41.3% |
| Inupiat | 0.0 /100 | #315 | Tragic 41.3% |
| Immigrants | Caribbean | 0.0 /100 | #316 | Tragic 41.3% |
| Haitians | 0.0 /100 | #317 | Tragic 41.3% |
| Bahamians | 0.0 /100 | #318 | Tragic 41.2% |
| Immigrants | Somalia | 0.0 /100 | #319 | Tragic 41.2% |
| Immigrants | Jamaica | 0.0 /100 | #320 | Tragic 41.1% |
| Immigrants | Congo | 0.0 /100 | #321 | Tragic 41.1% |
| Immigrants | Haiti | 0.0 /100 | #322 | Tragic 41.0% |
| Immigrants | West Indies | 0.0 /100 | #323 | Tragic 40.7% |
| Immigrants | Senegal | 0.0 /100 | #324 | Tragic 40.7% |
Demographics Similar to Spanish American Indians by Currently Married
In terms of currently married, the demographic groups most similar to Spanish American Indians are Immigrants from Eritrea (43.6%, a difference of 0.0%), Ecuadorian (43.6%, a difference of 0.030%), Immigrants from Bangladesh (43.6%, a difference of 0.10%), Immigrants from Sudan (43.5%, a difference of 0.12%), and Sudanese (43.7%, a difference of 0.18%).
| Demographics | Rating | Rank | Currently Married |
| Immigrants | Nicaragua | 0.1 /100 | #261 | Tragic 43.7% |
| Bangladeshis | 0.1 /100 | #262 | Tragic 43.7% |
| Immigrants | Cuba | 0.1 /100 | #263 | Tragic 43.7% |
| Sudanese | 0.1 /100 | #264 | Tragic 43.7% |
| Immigrants | Bangladesh | 0.1 /100 | #265 | Tragic 43.6% |
| Ecuadorians | 0.1 /100 | #266 | Tragic 43.6% |
| Immigrants | Eritrea | 0.1 /100 | #267 | Tragic 43.6% |
| Spanish American Indians | 0.1 /100 | #268 | Tragic 43.6% |
| Immigrants | Sudan | 0.1 /100 | #269 | Tragic 43.5% |
| Salvadorans | 0.1 /100 | #270 | Tragic 43.5% |
| Bermudans | 0.1 /100 | #271 | Tragic 43.5% |
| Indonesians | 0.1 /100 | #272 | Tragic 43.5% |
| Yaqui | 0.1 /100 | #273 | Tragic 43.4% |
| Nigerians | 0.1 /100 | #274 | Tragic 43.4% |
| Colville | 0.1 /100 | #275 | Tragic 43.4% |