Guyanese vs Immigrants from Denmark In Labor Force | Age 35-44
COMPARE
Guyanese
Immigrants from Denmark
In Labor Force | Age 35-44
In Labor Force | Age 35-44 Comparison
Guyanese
Immigrants from Denmark
83.8%
IN LABOR FORCE | AGE 35-44
1.1/ 100
METRIC RATING
244th/ 347
METRIC RANK
84.3%
IN LABOR FORCE | AGE 35-44
33.7/ 100
METRIC RATING
189th/ 347
METRIC RANK
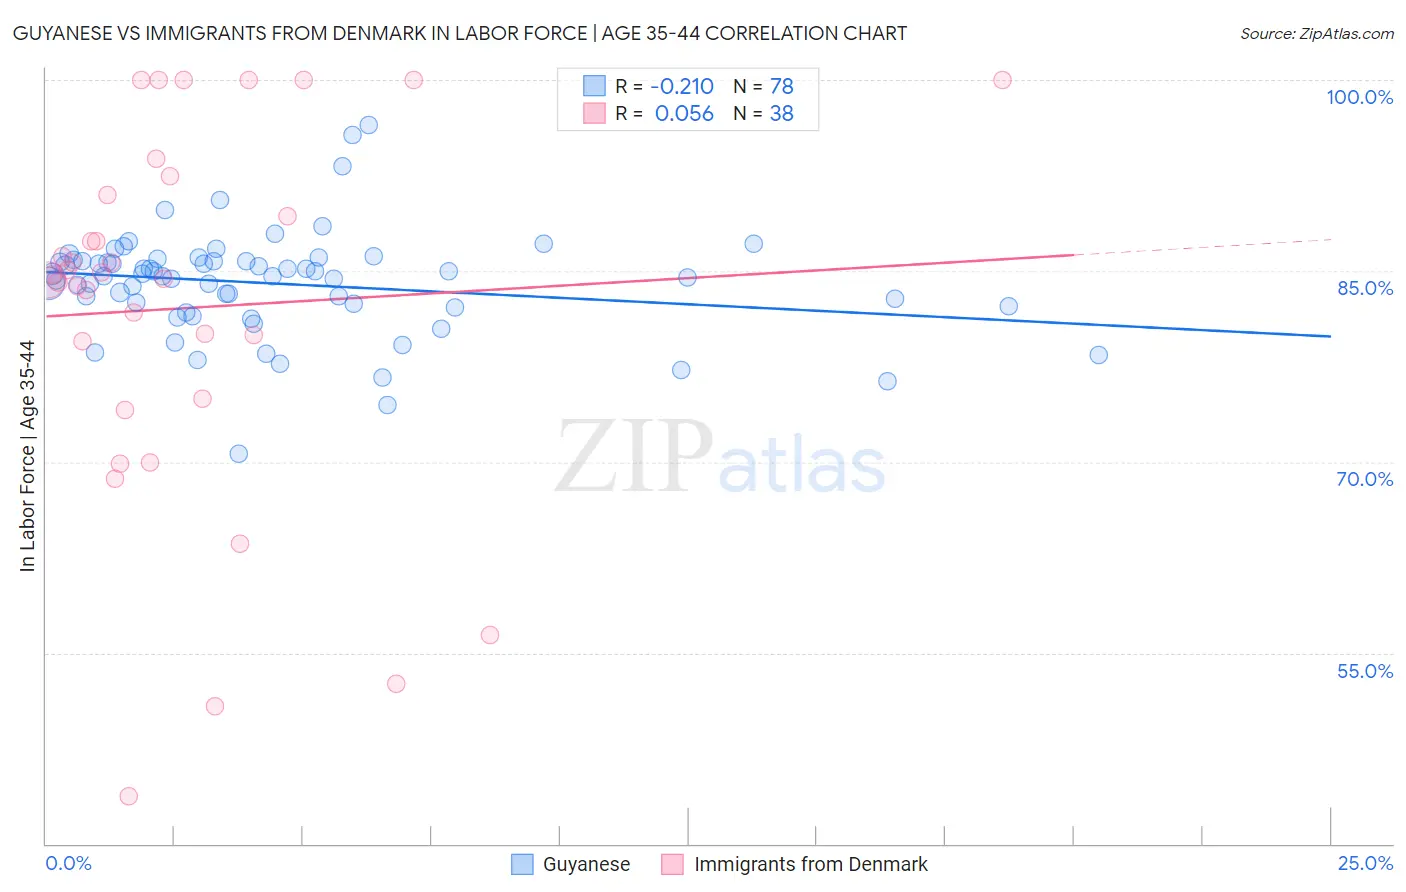
Guyanese vs Immigrants from Denmark In Labor Force | Age 35-44 Correlation Chart
The statistical analysis conducted on geographies consisting of 176,803,222 people shows a weak negative correlation between the proportion of Guyanese and labor force participation rate among population between the ages 35 and 44 in the United States with a correlation coefficient (R) of -0.210 and weighted average of 83.8%. Similarly, the statistical analysis conducted on geographies consisting of 136,414,422 people shows a slight positive correlation between the proportion of Immigrants from Denmark and labor force participation rate among population between the ages 35 and 44 in the United States with a correlation coefficient (R) of 0.056 and weighted average of 84.3%, a difference of 0.62%.
In Labor Force | Age 35-44 Correlation Summary
| Measurement | Guyanese | Immigrants from Denmark |
| Minimum | 70.6% | 43.7% |
| Maximum | 96.5% | 100.0% |
| Range | 25.9% | 56.3% |
| Mean | 84.0% | 82.1% |
| Median | 84.6% | 84.6% |
| Interquartile 25% (IQ1) | 82.2% | 75.0% |
| Interquartile 75% (IQ3) | 85.8% | 91.0% |
| Interquartile Range (IQR) | 3.6% | 16.0% |
| Standard Deviation (Sample) | 4.1% | 14.4% |
| Standard Deviation (Population) | 4.1% | 14.2% |
Similar Demographics by In Labor Force | Age 35-44
Demographics Similar to Guyanese by In Labor Force | Age 35-44
In terms of in labor force | age 35-44, the demographic groups most similar to Guyanese are Immigrants from Western Asia (83.8%, a difference of 0.0%), Malaysian (83.8%, a difference of 0.0%), Immigrants from Cambodia (83.8%, a difference of 0.010%), Immigrants (83.7%, a difference of 0.010%), and Arab (83.8%, a difference of 0.030%).
| Demographics | Rating | Rank | In Labor Force | Age 35-44 |
| English | 1.8 /100 | #237 | Tragic 83.8% |
| Immigrants | Laos | 1.7 /100 | #238 | Tragic 83.8% |
| Celtics | 1.4 /100 | #239 | Tragic 83.8% |
| Arabs | 1.3 /100 | #240 | Tragic 83.8% |
| Iraqis | 1.3 /100 | #241 | Tragic 83.8% |
| Immigrants | Cambodia | 1.1 /100 | #242 | Tragic 83.8% |
| Immigrants | Western Asia | 1.1 /100 | #243 | Tragic 83.8% |
| Guyanese | 1.1 /100 | #244 | Tragic 83.8% |
| Malaysians | 1.1 /100 | #245 | Tragic 83.8% |
| Immigrants | Immigrants | 1.0 /100 | #246 | Tragic 83.7% |
| Immigrants | Armenia | 0.9 /100 | #247 | Tragic 83.7% |
| Indonesians | 0.8 /100 | #248 | Tragic 83.7% |
| Immigrants | St. Vincent and the Grenadines | 0.7 /100 | #249 | Tragic 83.7% |
| Whites/Caucasians | 0.5 /100 | #250 | Tragic 83.6% |
| Salvadorans | 0.4 /100 | #251 | Tragic 83.6% |
Demographics Similar to Immigrants from Denmark by In Labor Force | Age 35-44
In terms of in labor force | age 35-44, the demographic groups most similar to Immigrants from Denmark are South African (84.3%, a difference of 0.0%), Armenian (84.3%, a difference of 0.010%), Costa Rican (84.3%, a difference of 0.010%), Australian (84.3%, a difference of 0.010%), and Dutch (84.3%, a difference of 0.010%).
| Demographics | Rating | Rank | In Labor Force | Age 35-44 |
| Koreans | 36.3 /100 | #182 | Fair 84.3% |
| Barbadians | 36.2 /100 | #183 | Fair 84.3% |
| Armenians | 35.6 /100 | #184 | Fair 84.3% |
| Costa Ricans | 35.3 /100 | #185 | Fair 84.3% |
| Australians | 35.1 /100 | #186 | Fair 84.3% |
| Dutch | 34.8 /100 | #187 | Fair 84.3% |
| South Africans | 34.1 /100 | #188 | Fair 84.3% |
| Immigrants | Denmark | 33.7 /100 | #189 | Fair 84.3% |
| Portuguese | 31.9 /100 | #190 | Fair 84.3% |
| Immigrants | Philippines | 27.9 /100 | #191 | Fair 84.2% |
| Immigrants | Vietnam | 27.4 /100 | #192 | Fair 84.2% |
| Hungarians | 26.8 /100 | #193 | Fair 84.2% |
| Immigrants | Indonesia | 25.7 /100 | #194 | Fair 84.2% |
| Immigrants | Caribbean | 25.7 /100 | #195 | Fair 84.2% |
| Immigrants | England | 25.0 /100 | #196 | Fair 84.2% |