Thai vs Immigrants from Denmark Currently Married
COMPARE
Thai
Immigrants from Denmark
Currently Married
Currently Married Comparison
Thais
Immigrants from Denmark
50.9%
CURRENTLY MARRIED
100.0/ 100
METRIC RATING
2nd/ 347
METRIC RANK
47.6%
CURRENTLY MARRIED
90.9/ 100
METRIC RATING
113th/ 347
METRIC RANK
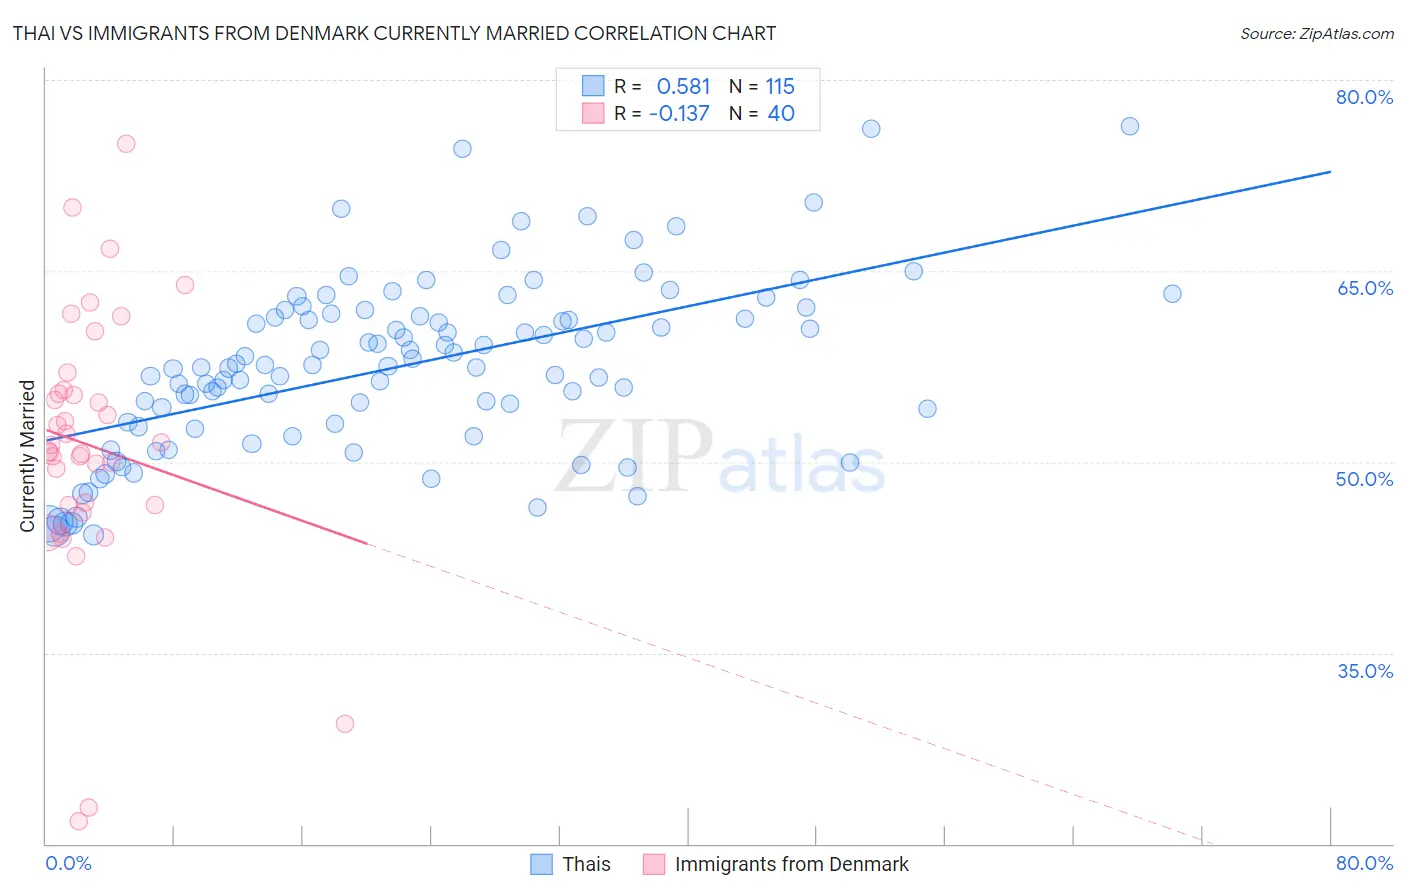
Thai vs Immigrants from Denmark Currently Married Correlation Chart
The statistical analysis conducted on geographies consisting of 475,756,416 people shows a substantial positive correlation between the proportion of Thais and percentage of population currently married in the United States with a correlation coefficient (R) of 0.581 and weighted average of 50.9%. Similarly, the statistical analysis conducted on geographies consisting of 136,433,385 people shows a poor negative correlation between the proportion of Immigrants from Denmark and percentage of population currently married in the United States with a correlation coefficient (R) of -0.137 and weighted average of 47.6%, a difference of 6.8%.
Currently Married Correlation Summary
| Measurement | Thai | Immigrants from Denmark |
| Minimum | 44.3% | 21.8% |
| Maximum | 76.4% | 75.0% |
| Range | 32.1% | 53.2% |
| Mean | 57.5% | 51.3% |
| Median | 57.5% | 51.1% |
| Interquartile 25% (IQ1) | 52.8% | 46.6% |
| Interquartile 75% (IQ3) | 61.5% | 55.5% |
| Interquartile Range (IQR) | 8.7% | 8.9% |
| Standard Deviation (Sample) | 6.8% | 10.6% |
| Standard Deviation (Population) | 6.8% | 10.5% |
Similar Demographics by Currently Married
Demographics Similar to Thais by Currently Married
In terms of currently married, the demographic groups most similar to Thais are Assyrian/Chaldean/Syriac (50.8%, a difference of 0.18%), Immigrants from Taiwan (50.7%, a difference of 0.26%), Danish (50.5%, a difference of 0.81%), Norwegian (50.2%, a difference of 1.4%), and Immigrants from South Central Asia (50.0%, a difference of 1.7%).
| Demographics | Rating | Rank | Currently Married |
| Immigrants | India | 100.0 /100 | #1 | Exceptional 51.8% |
| Thais | 100.0 /100 | #2 | Exceptional 50.9% |
| Assyrians/Chaldeans/Syriacs | 100.0 /100 | #3 | Exceptional 50.8% |
| Immigrants | Taiwan | 100.0 /100 | #4 | Exceptional 50.7% |
| Danes | 100.0 /100 | #5 | Exceptional 50.5% |
| Norwegians | 100.0 /100 | #6 | Exceptional 50.2% |
| Immigrants | South Central Asia | 100.0 /100 | #7 | Exceptional 50.0% |
| Swedes | 100.0 /100 | #8 | Exceptional 50.0% |
| Czechs | 99.9 /100 | #9 | Exceptional 49.9% |
| Filipinos | 99.9 /100 | #10 | Exceptional 49.7% |
| English | 99.9 /100 | #11 | Exceptional 49.7% |
| Swiss | 99.9 /100 | #12 | Exceptional 49.7% |
| Dutch | 99.9 /100 | #13 | Exceptional 49.6% |
| Germans | 99.9 /100 | #14 | Exceptional 49.6% |
| Pennsylvania Germans | 99.9 /100 | #15 | Exceptional 49.6% |
Demographics Similar to Immigrants from Denmark by Currently Married
In terms of currently married, the demographic groups most similar to Immigrants from Denmark are Immigrants from Western Europe (47.6%, a difference of 0.030%), South African (47.6%, a difference of 0.030%), Immigrants from Hungary (47.6%, a difference of 0.040%), Immigrants from Indonesia (47.6%, a difference of 0.040%), and Palestinian (47.6%, a difference of 0.050%).
| Demographics | Rating | Rank | Currently Married |
| Immigrants | Greece | 93.1 /100 | #106 | Exceptional 47.7% |
| Immigrants | Italy | 92.9 /100 | #107 | Exceptional 47.7% |
| Tsimshian | 92.4 /100 | #108 | Exceptional 47.7% |
| Immigrants | Egypt | 92.3 /100 | #109 | Exceptional 47.7% |
| Immigrants | Russia | 92.0 /100 | #110 | Exceptional 47.7% |
| Immigrants | Hungary | 91.2 /100 | #111 | Exceptional 47.6% |
| Immigrants | Western Europe | 91.1 /100 | #112 | Exceptional 47.6% |
| Immigrants | Denmark | 90.9 /100 | #113 | Exceptional 47.6% |
| South Africans | 90.5 /100 | #114 | Exceptional 47.6% |
| Immigrants | Indonesia | 90.5 /100 | #115 | Exceptional 47.6% |
| Palestinians | 90.4 /100 | #116 | Exceptional 47.6% |
| Puget Sound Salish | 90.3 /100 | #117 | Exceptional 47.6% |
| Immigrants | Philippines | 90.2 /100 | #118 | Exceptional 47.6% |
| Australians | 90.2 /100 | #119 | Exceptional 47.6% |
| Syrians | 88.9 /100 | #120 | Excellent 47.5% |