Native Hawaiian vs Immigrants from Denmark Currently Married
COMPARE
Native Hawaiian
Immigrants from Denmark
Currently Married
Currently Married Comparison
Native Hawaiians
Immigrants from Denmark
47.9%
CURRENTLY MARRIED
95.0/ 100
METRIC RATING
94th/ 347
METRIC RANK
47.6%
CURRENTLY MARRIED
90.9/ 100
METRIC RATING
113th/ 347
METRIC RANK
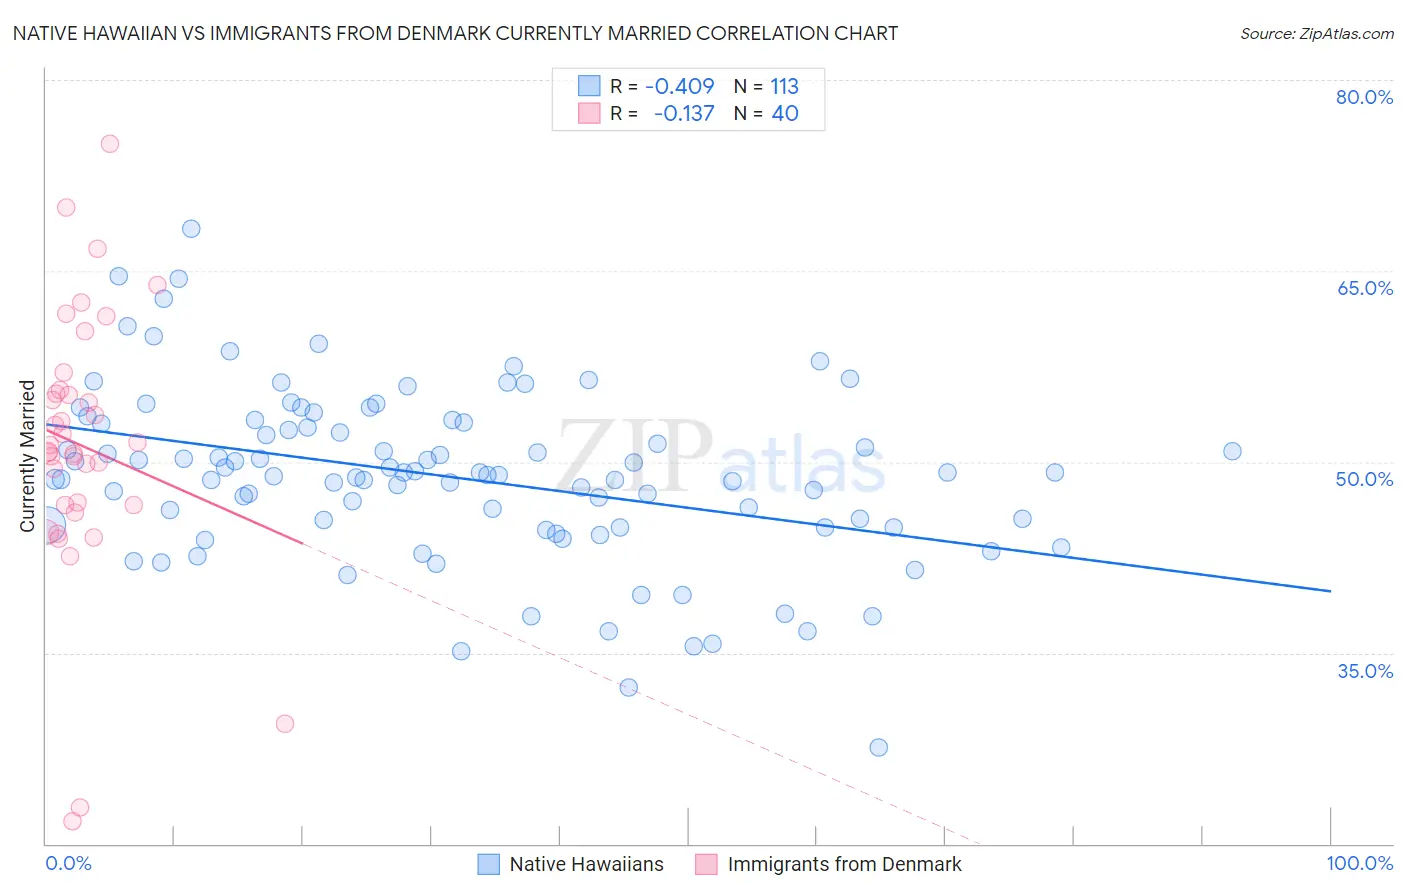
Native Hawaiian vs Immigrants from Denmark Currently Married Correlation Chart
The statistical analysis conducted on geographies consisting of 332,071,808 people shows a moderate negative correlation between the proportion of Native Hawaiians and percentage of population currently married in the United States with a correlation coefficient (R) of -0.409 and weighted average of 47.9%. Similarly, the statistical analysis conducted on geographies consisting of 136,433,385 people shows a poor negative correlation between the proportion of Immigrants from Denmark and percentage of population currently married in the United States with a correlation coefficient (R) of -0.137 and weighted average of 47.6%, a difference of 0.59%.
Currently Married Correlation Summary
| Measurement | Native Hawaiian | Immigrants from Denmark |
| Minimum | 27.6% | 21.8% |
| Maximum | 68.3% | 75.0% |
| Range | 40.7% | 53.2% |
| Mean | 48.8% | 51.3% |
| Median | 49.0% | 51.1% |
| Interquartile 25% (IQ1) | 44.8% | 46.6% |
| Interquartile 75% (IQ3) | 53.0% | 55.5% |
| Interquartile Range (IQR) | 8.2% | 8.9% |
| Standard Deviation (Sample) | 6.8% | 10.6% |
| Standard Deviation (Population) | 6.8% | 10.5% |
Demographics Similar to Native Hawaiians and Immigrants from Denmark by Currently Married
In terms of currently married, the demographic groups most similar to Native Hawaiians are Lebanese (47.9%, a difference of 0.010%), Immigrants from Bulgaria (47.9%, a difference of 0.040%), Egyptian (47.9%, a difference of 0.040%), Immigrants from Ukraine (47.9%, a difference of 0.040%), and Immigrants from China (47.9%, a difference of 0.060%). Similarly, the demographic groups most similar to Immigrants from Denmark are Immigrants from Western Europe (47.6%, a difference of 0.030%), Immigrants from Hungary (47.6%, a difference of 0.040%), Immigrants from Russia (47.7%, a difference of 0.13%), Immigrants from Egypt (47.7%, a difference of 0.16%), and Tsimshian (47.7%, a difference of 0.18%).
| Demographics | Rating | Rank | Currently Married |
| Lebanese | 95.1 /100 | #93 | Exceptional 47.9% |
| Native Hawaiians | 95.0 /100 | #94 | Exceptional 47.9% |
| Immigrants | Bulgaria | 94.8 /100 | #95 | Exceptional 47.9% |
| Egyptians | 94.8 /100 | #96 | Exceptional 47.9% |
| Immigrants | Ukraine | 94.8 /100 | #97 | Exceptional 47.9% |
| Immigrants | China | 94.7 /100 | #98 | Exceptional 47.9% |
| Immigrants | Sweden | 94.3 /100 | #99 | Exceptional 47.8% |
| Celtics | 94.2 /100 | #100 | Exceptional 47.8% |
| Immigrants | Germany | 94.1 /100 | #101 | Exceptional 47.8% |
| Turks | 93.9 /100 | #102 | Exceptional 47.8% |
| Cypriots | 93.7 /100 | #103 | Exceptional 47.8% |
| Serbians | 93.6 /100 | #104 | Exceptional 47.8% |
| Immigrants | Singapore | 93.3 /100 | #105 | Exceptional 47.8% |
| Immigrants | Greece | 93.1 /100 | #106 | Exceptional 47.7% |
| Immigrants | Italy | 92.9 /100 | #107 | Exceptional 47.7% |
| Tsimshian | 92.4 /100 | #108 | Exceptional 47.7% |
| Immigrants | Egypt | 92.3 /100 | #109 | Exceptional 47.7% |
| Immigrants | Russia | 92.0 /100 | #110 | Exceptional 47.7% |
| Immigrants | Hungary | 91.2 /100 | #111 | Exceptional 47.6% |
| Immigrants | Western Europe | 91.1 /100 | #112 | Exceptional 47.6% |
| Immigrants | Denmark | 90.9 /100 | #113 | Exceptional 47.6% |