Immigrants from Uruguay vs Immigrants from Denmark Currently Married
COMPARE
Immigrants from Uruguay
Immigrants from Denmark
Currently Married
Currently Married Comparison
Immigrants from Uruguay
Immigrants from Denmark
45.0%
CURRENTLY MARRIED
2.0/ 100
METRIC RATING
228th/ 347
METRIC RANK
47.6%
CURRENTLY MARRIED
90.9/ 100
METRIC RATING
113th/ 347
METRIC RANK
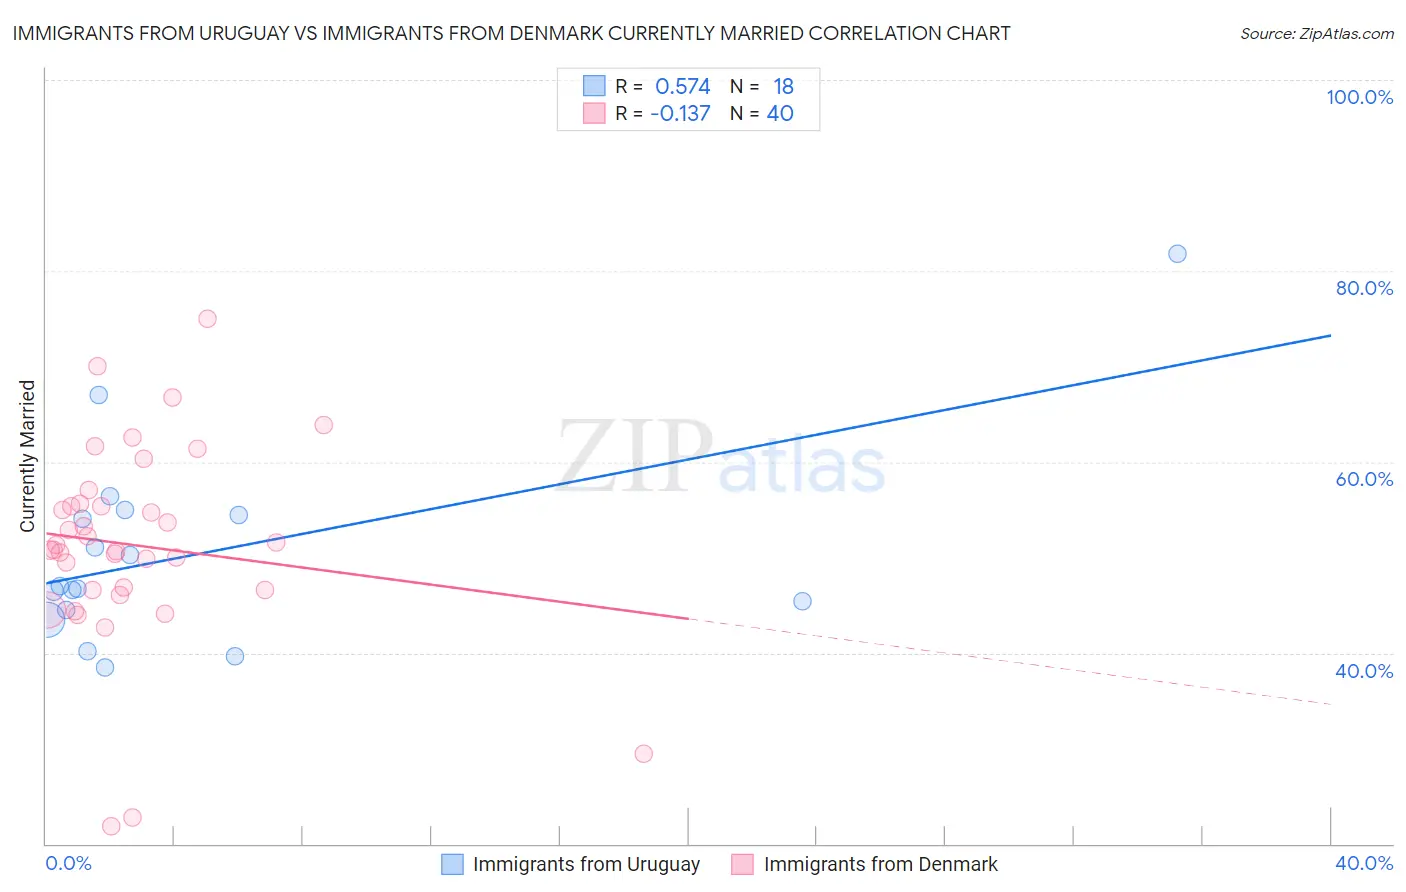
Immigrants from Uruguay vs Immigrants from Denmark Currently Married Correlation Chart
The statistical analysis conducted on geographies consisting of 133,250,872 people shows a substantial positive correlation between the proportion of Immigrants from Uruguay and percentage of population currently married in the United States with a correlation coefficient (R) of 0.574 and weighted average of 45.0%. Similarly, the statistical analysis conducted on geographies consisting of 136,433,385 people shows a poor negative correlation between the proportion of Immigrants from Denmark and percentage of population currently married in the United States with a correlation coefficient (R) of -0.137 and weighted average of 47.6%, a difference of 5.8%.
Currently Married Correlation Summary
| Measurement | Immigrants from Uruguay | Immigrants from Denmark |
| Minimum | 38.5% | 21.8% |
| Maximum | 81.8% | 75.0% |
| Range | 43.3% | 53.2% |
| Mean | 50.5% | 51.3% |
| Median | 46.8% | 51.1% |
| Interquartile 25% (IQ1) | 44.5% | 46.6% |
| Interquartile 75% (IQ3) | 54.4% | 55.5% |
| Interquartile Range (IQR) | 9.9% | 8.9% |
| Standard Deviation (Sample) | 10.5% | 10.6% |
| Standard Deviation (Population) | 10.2% | 10.5% |
Similar Demographics by Currently Married
Demographics Similar to Immigrants from Uruguay by Currently Married
In terms of currently married, the demographic groups most similar to Immigrants from Uruguay are Spanish American (45.0%, a difference of 0.0%), Comanche (45.0%, a difference of 0.010%), Immigrants from Uganda (45.0%, a difference of 0.060%), French American Indian (45.0%, a difference of 0.060%), and Immigrants from Laos (45.0%, a difference of 0.11%).
| Demographics | Rating | Rank | Currently Married |
| Mexicans | 3.0 /100 | #221 | Tragic 45.2% |
| Immigrants | Azores | 2.5 /100 | #222 | Tragic 45.1% |
| Immigrants | Laos | 2.3 /100 | #223 | Tragic 45.0% |
| Immigrants | Uganda | 2.2 /100 | #224 | Tragic 45.0% |
| French American Indians | 2.2 /100 | #225 | Tragic 45.0% |
| Comanche | 2.1 /100 | #226 | Tragic 45.0% |
| Spanish Americans | 2.1 /100 | #227 | Tragic 45.0% |
| Immigrants | Uruguay | 2.0 /100 | #228 | Tragic 45.0% |
| Cree | 1.7 /100 | #229 | Tragic 44.9% |
| Immigrants | Kenya | 1.6 /100 | #230 | Tragic 44.9% |
| Immigrants | Panama | 1.5 /100 | #231 | Tragic 44.9% |
| Nepalese | 1.2 /100 | #232 | Tragic 44.7% |
| Immigrants | Saudi Arabia | 1.1 /100 | #233 | Tragic 44.7% |
| Iroquois | 1.1 /100 | #234 | Tragic 44.7% |
| Alaskan Athabascans | 0.9 /100 | #235 | Tragic 44.6% |
Demographics Similar to Immigrants from Denmark by Currently Married
In terms of currently married, the demographic groups most similar to Immigrants from Denmark are Immigrants from Western Europe (47.6%, a difference of 0.030%), South African (47.6%, a difference of 0.030%), Immigrants from Hungary (47.6%, a difference of 0.040%), Immigrants from Indonesia (47.6%, a difference of 0.040%), and Palestinian (47.6%, a difference of 0.050%).
| Demographics | Rating | Rank | Currently Married |
| Immigrants | Greece | 93.1 /100 | #106 | Exceptional 47.7% |
| Immigrants | Italy | 92.9 /100 | #107 | Exceptional 47.7% |
| Tsimshian | 92.4 /100 | #108 | Exceptional 47.7% |
| Immigrants | Egypt | 92.3 /100 | #109 | Exceptional 47.7% |
| Immigrants | Russia | 92.0 /100 | #110 | Exceptional 47.7% |
| Immigrants | Hungary | 91.2 /100 | #111 | Exceptional 47.6% |
| Immigrants | Western Europe | 91.1 /100 | #112 | Exceptional 47.6% |
| Immigrants | Denmark | 90.9 /100 | #113 | Exceptional 47.6% |
| South Africans | 90.5 /100 | #114 | Exceptional 47.6% |
| Immigrants | Indonesia | 90.5 /100 | #115 | Exceptional 47.6% |
| Palestinians | 90.4 /100 | #116 | Exceptional 47.6% |
| Puget Sound Salish | 90.3 /100 | #117 | Exceptional 47.6% |
| Immigrants | Philippines | 90.2 /100 | #118 | Exceptional 47.6% |
| Australians | 90.2 /100 | #119 | Exceptional 47.6% |
| Syrians | 88.9 /100 | #120 | Excellent 47.5% |