Guatemalan vs Mexican Currently Married
COMPARE
Guatemalan
Mexican
Currently Married
Currently Married Comparison
Guatemalans
Mexicans
42.9%
CURRENTLY MARRIED
0.0/ 100
METRIC RATING
287th/ 347
METRIC RANK
45.2%
CURRENTLY MARRIED
3.0/ 100
METRIC RATING
221st/ 347
METRIC RANK
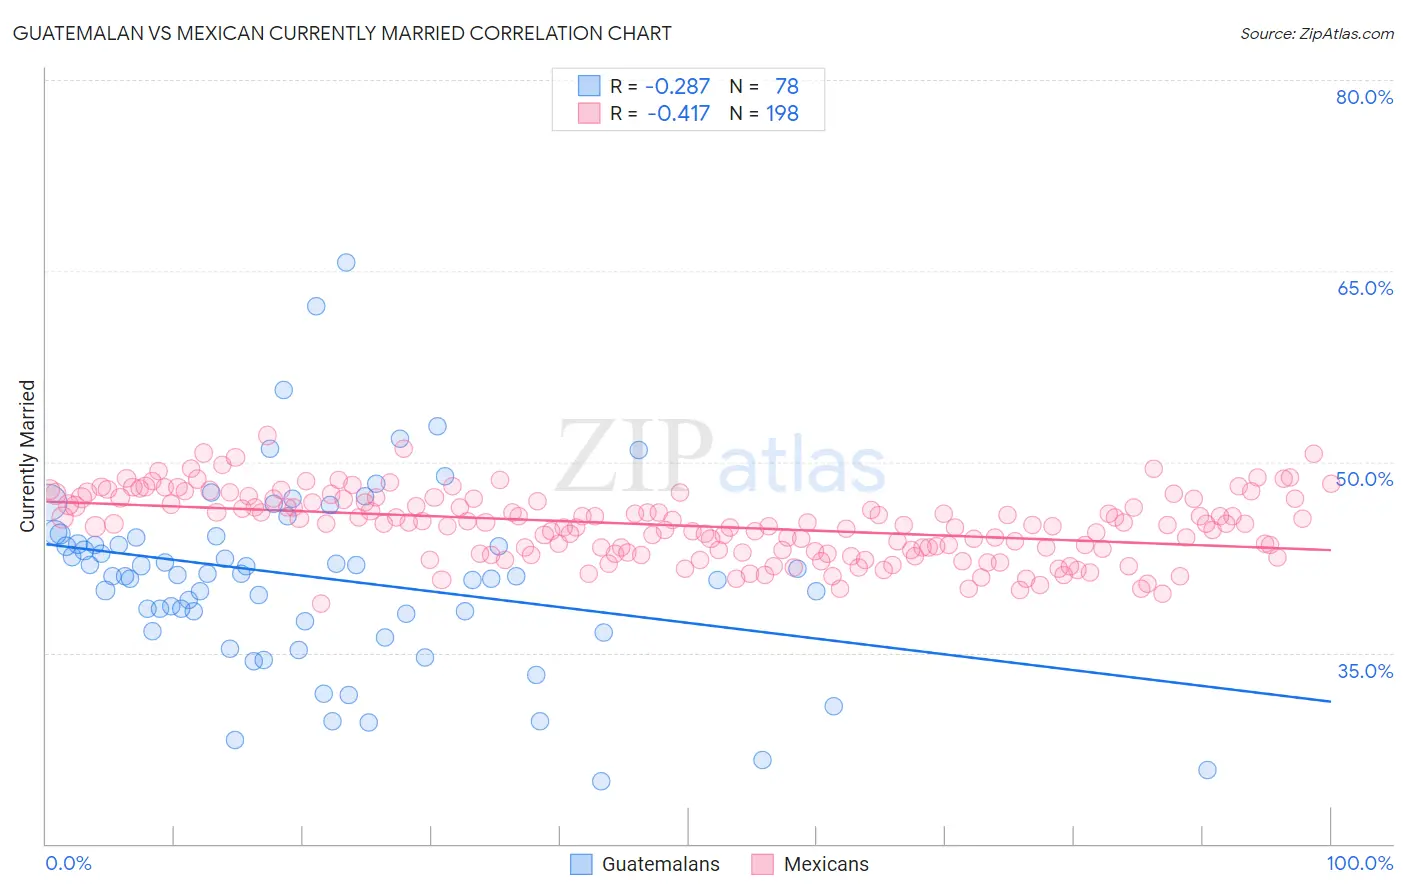
Guatemalan vs Mexican Currently Married Correlation Chart
The statistical analysis conducted on geographies consisting of 409,507,416 people shows a weak negative correlation between the proportion of Guatemalans and percentage of population currently married in the United States with a correlation coefficient (R) of -0.287 and weighted average of 42.9%. Similarly, the statistical analysis conducted on geographies consisting of 565,159,836 people shows a moderate negative correlation between the proportion of Mexicans and percentage of population currently married in the United States with a correlation coefficient (R) of -0.417 and weighted average of 45.2%, a difference of 5.2%.
Currently Married Correlation Summary
| Measurement | Guatemalan | Mexican |
| Minimum | 24.9% | 38.9% |
| Maximum | 65.6% | 52.1% |
| Range | 40.7% | 13.2% |
| Mean | 40.9% | 45.0% |
| Median | 41.1% | 45.1% |
| Interquartile 25% (IQ1) | 37.5% | 43.0% |
| Interquartile 75% (IQ3) | 44.0% | 47.1% |
| Interquartile Range (IQR) | 6.5% | 4.1% |
| Standard Deviation (Sample) | 7.3% | 2.6% |
| Standard Deviation (Population) | 7.2% | 2.6% |
Similar Demographics by Currently Married
Demographics Similar to Guatemalans by Currently Married
In terms of currently married, the demographic groups most similar to Guatemalans are Ghanaian (42.9%, a difference of 0.020%), Immigrants from Middle Africa (43.0%, a difference of 0.15%), Native/Alaskan (42.8%, a difference of 0.27%), Paiute (42.7%, a difference of 0.50%), and Immigrants from Ghana (42.7%, a difference of 0.51%).
| Demographics | Rating | Rank | Currently Married |
| Apache | 0.0 /100 | #280 | Tragic 43.2% |
| Chippewa | 0.0 /100 | #281 | Tragic 43.2% |
| Immigrants | Ecuador | 0.0 /100 | #282 | Tragic 43.2% |
| Kiowa | 0.0 /100 | #283 | Tragic 43.2% |
| Immigrants | El Salvador | 0.0 /100 | #284 | Tragic 43.1% |
| Immigrants | Middle Africa | 0.0 /100 | #285 | Tragic 43.0% |
| Ghanaians | 0.0 /100 | #286 | Tragic 42.9% |
| Guatemalans | 0.0 /100 | #287 | Tragic 42.9% |
| Natives/Alaskans | 0.0 /100 | #288 | Tragic 42.8% |
| Paiute | 0.0 /100 | #289 | Tragic 42.7% |
| Immigrants | Ghana | 0.0 /100 | #290 | Tragic 42.7% |
| Immigrants | Guatemala | 0.0 /100 | #291 | Tragic 42.6% |
| Sub-Saharan Africans | 0.0 /100 | #292 | Tragic 42.6% |
| Yuman | 0.0 /100 | #293 | Tragic 42.6% |
| Hondurans | 0.0 /100 | #294 | Tragic 42.5% |
Demographics Similar to Mexicans by Currently Married
In terms of currently married, the demographic groups most similar to Mexicans are Kenyan (45.2%, a difference of 0.020%), Immigrants from Portugal (45.2%, a difference of 0.14%), Immigrants from the Azores (45.1%, a difference of 0.20%), Panamanian (45.3%, a difference of 0.26%), and Immigrants from Laos (45.0%, a difference of 0.28%).
| Demographics | Rating | Rank | Currently Married |
| Dutch West Indians | 6.7 /100 | #214 | Tragic 45.5% |
| German Russians | 6.7 /100 | #215 | Tragic 45.5% |
| Immigrants | Morocco | 5.5 /100 | #216 | Tragic 45.4% |
| Immigrants | Thailand | 5.1 /100 | #217 | Tragic 45.4% |
| Panamanians | 4.0 /100 | #218 | Tragic 45.3% |
| Immigrants | Portugal | 3.5 /100 | #219 | Tragic 45.2% |
| Kenyans | 3.1 /100 | #220 | Tragic 45.2% |
| Mexicans | 3.0 /100 | #221 | Tragic 45.2% |
| Immigrants | Azores | 2.5 /100 | #222 | Tragic 45.1% |
| Immigrants | Laos | 2.3 /100 | #223 | Tragic 45.0% |
| Immigrants | Uganda | 2.2 /100 | #224 | Tragic 45.0% |
| French American Indians | 2.2 /100 | #225 | Tragic 45.0% |
| Comanche | 2.1 /100 | #226 | Tragic 45.0% |
| Spanish Americans | 2.1 /100 | #227 | Tragic 45.0% |
| Immigrants | Uruguay | 2.0 /100 | #228 | Tragic 45.0% |