Guatemalan vs Immigrants from Sweden Currently Married
COMPARE
Guatemalan
Immigrants from Sweden
Currently Married
Currently Married Comparison
Guatemalans
Immigrants from Sweden
42.9%
CURRENTLY MARRIED
0.0/ 100
METRIC RATING
287th/ 347
METRIC RANK
47.8%
CURRENTLY MARRIED
94.3/ 100
METRIC RATING
99th/ 347
METRIC RANK
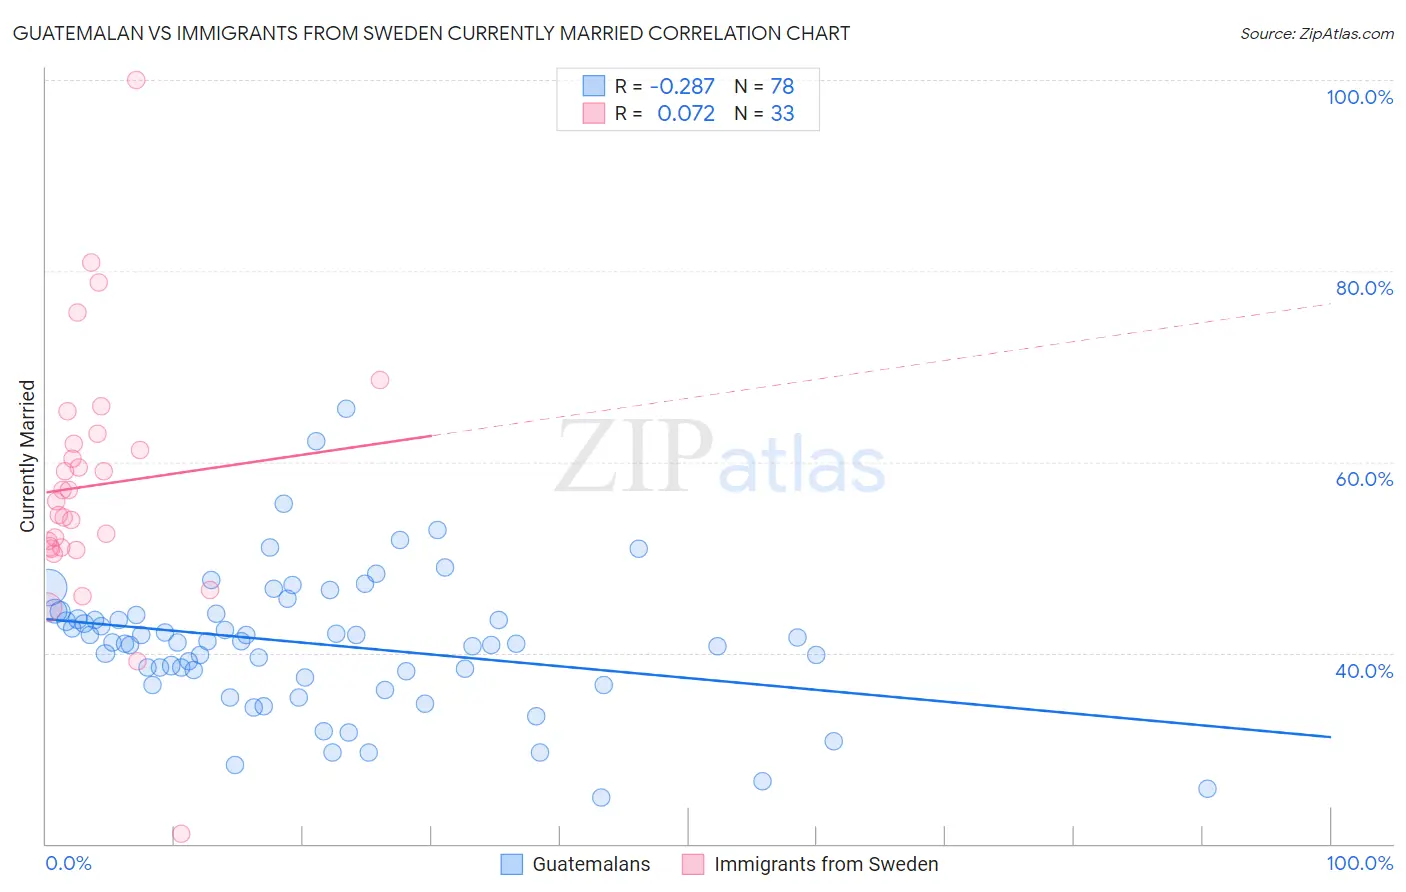
Guatemalan vs Immigrants from Sweden Currently Married Correlation Chart
The statistical analysis conducted on geographies consisting of 409,507,416 people shows a weak negative correlation between the proportion of Guatemalans and percentage of population currently married in the United States with a correlation coefficient (R) of -0.287 and weighted average of 42.9%. Similarly, the statistical analysis conducted on geographies consisting of 164,728,408 people shows a slight positive correlation between the proportion of Immigrants from Sweden and percentage of population currently married in the United States with a correlation coefficient (R) of 0.072 and weighted average of 47.8%, a difference of 11.4%.
Currently Married Correlation Summary
| Measurement | Guatemalan | Immigrants from Sweden |
| Minimum | 24.9% | 21.1% |
| Maximum | 65.6% | 100.0% |
| Range | 40.7% | 78.9% |
| Mean | 40.9% | 57.6% |
| Median | 41.1% | 55.9% |
| Interquartile 25% (IQ1) | 37.5% | 51.0% |
| Interquartile 75% (IQ3) | 44.0% | 62.4% |
| Interquartile Range (IQR) | 6.5% | 11.5% |
| Standard Deviation (Sample) | 7.3% | 13.6% |
| Standard Deviation (Population) | 7.2% | 13.4% |
Similar Demographics by Currently Married
Demographics Similar to Guatemalans by Currently Married
In terms of currently married, the demographic groups most similar to Guatemalans are Ghanaian (42.9%, a difference of 0.020%), Immigrants from Middle Africa (43.0%, a difference of 0.15%), Native/Alaskan (42.8%, a difference of 0.27%), Paiute (42.7%, a difference of 0.50%), and Immigrants from Ghana (42.7%, a difference of 0.51%).
| Demographics | Rating | Rank | Currently Married |
| Apache | 0.0 /100 | #280 | Tragic 43.2% |
| Chippewa | 0.0 /100 | #281 | Tragic 43.2% |
| Immigrants | Ecuador | 0.0 /100 | #282 | Tragic 43.2% |
| Kiowa | 0.0 /100 | #283 | Tragic 43.2% |
| Immigrants | El Salvador | 0.0 /100 | #284 | Tragic 43.1% |
| Immigrants | Middle Africa | 0.0 /100 | #285 | Tragic 43.0% |
| Ghanaians | 0.0 /100 | #286 | Tragic 42.9% |
| Guatemalans | 0.0 /100 | #287 | Tragic 42.9% |
| Natives/Alaskans | 0.0 /100 | #288 | Tragic 42.8% |
| Paiute | 0.0 /100 | #289 | Tragic 42.7% |
| Immigrants | Ghana | 0.0 /100 | #290 | Tragic 42.7% |
| Immigrants | Guatemala | 0.0 /100 | #291 | Tragic 42.6% |
| Sub-Saharan Africans | 0.0 /100 | #292 | Tragic 42.6% |
| Yuman | 0.0 /100 | #293 | Tragic 42.6% |
| Hondurans | 0.0 /100 | #294 | Tragic 42.5% |
Demographics Similar to Immigrants from Sweden by Currently Married
In terms of currently married, the demographic groups most similar to Immigrants from Sweden are Celtic (47.8%, a difference of 0.020%), Immigrants from Germany (47.8%, a difference of 0.040%), Turkish (47.8%, a difference of 0.060%), Immigrants from China (47.9%, a difference of 0.080%), and Immigrants from Ukraine (47.9%, a difference of 0.090%).
| Demographics | Rating | Rank | Currently Married |
| Koreans | 95.4 /100 | #92 | Exceptional 47.9% |
| Lebanese | 95.1 /100 | #93 | Exceptional 47.9% |
| Native Hawaiians | 95.0 /100 | #94 | Exceptional 47.9% |
| Immigrants | Bulgaria | 94.8 /100 | #95 | Exceptional 47.9% |
| Egyptians | 94.8 /100 | #96 | Exceptional 47.9% |
| Immigrants | Ukraine | 94.8 /100 | #97 | Exceptional 47.9% |
| Immigrants | China | 94.7 /100 | #98 | Exceptional 47.9% |
| Immigrants | Sweden | 94.3 /100 | #99 | Exceptional 47.8% |
| Celtics | 94.2 /100 | #100 | Exceptional 47.8% |
| Immigrants | Germany | 94.1 /100 | #101 | Exceptional 47.8% |
| Turks | 93.9 /100 | #102 | Exceptional 47.8% |
| Cypriots | 93.7 /100 | #103 | Exceptional 47.8% |
| Serbians | 93.6 /100 | #104 | Exceptional 47.8% |
| Immigrants | Singapore | 93.3 /100 | #105 | Exceptional 47.8% |
| Immigrants | Greece | 93.1 /100 | #106 | Exceptional 47.7% |