Immigrants from Albania vs Mexican Currently Married
COMPARE
Immigrants from Albania
Mexican
Currently Married
Currently Married Comparison
Immigrants from Albania
Mexicans
45.9%
CURRENTLY MARRIED
14.5/ 100
METRIC RATING
202nd/ 347
METRIC RANK
45.2%
CURRENTLY MARRIED
3.0/ 100
METRIC RATING
221st/ 347
METRIC RANK
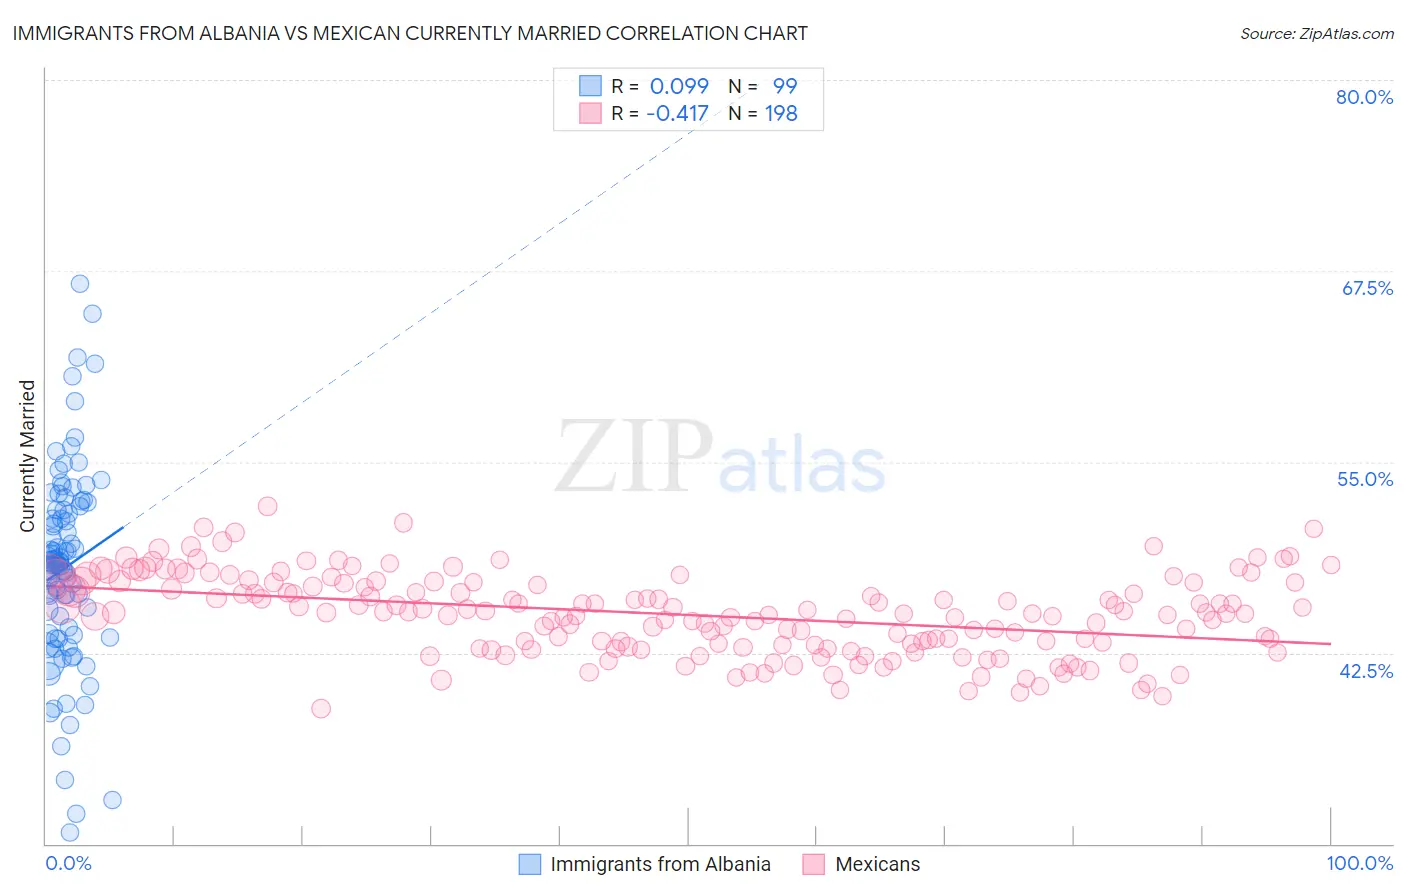
Immigrants from Albania vs Mexican Currently Married Correlation Chart
The statistical analysis conducted on geographies consisting of 119,394,885 people shows a slight positive correlation between the proportion of Immigrants from Albania and percentage of population currently married in the United States with a correlation coefficient (R) of 0.099 and weighted average of 45.9%. Similarly, the statistical analysis conducted on geographies consisting of 565,159,836 people shows a moderate negative correlation between the proportion of Mexicans and percentage of population currently married in the United States with a correlation coefficient (R) of -0.417 and weighted average of 45.2%, a difference of 1.6%.
Currently Married Correlation Summary
| Measurement | Immigrants from Albania | Mexican |
| Minimum | 30.7% | 38.9% |
| Maximum | 66.7% | 52.1% |
| Range | 36.0% | 13.2% |
| Mean | 48.1% | 45.0% |
| Median | 48.4% | 45.1% |
| Interquartile 25% (IQ1) | 43.7% | 43.0% |
| Interquartile 75% (IQ3) | 51.9% | 47.1% |
| Interquartile Range (IQR) | 8.2% | 4.1% |
| Standard Deviation (Sample) | 6.5% | 2.6% |
| Standard Deviation (Population) | 6.4% | 2.6% |
Demographics Similar to Immigrants from Albania and Mexicans by Currently Married
In terms of currently married, the demographic groups most similar to Immigrants from Albania are Malaysian (45.9%, a difference of 0.060%), Taiwanese (45.8%, a difference of 0.23%), Immigrants from Spain (45.8%, a difference of 0.24%), South American Indian (45.8%, a difference of 0.25%), and Immigrants (45.8%, a difference of 0.27%). Similarly, the demographic groups most similar to Mexicans are Kenyan (45.2%, a difference of 0.020%), Immigrants from Portugal (45.2%, a difference of 0.14%), Panamanian (45.3%, a difference of 0.26%), Immigrants from Thailand (45.4%, a difference of 0.50%), and Immigrants from Morocco (45.4%, a difference of 0.59%).
| Demographics | Rating | Rank | Currently Married |
| Malaysians | 15.3 /100 | #201 | Poor 45.9% |
| Immigrants | Albania | 14.5 /100 | #202 | Poor 45.9% |
| Taiwanese | 11.7 /100 | #203 | Poor 45.8% |
| Immigrants | Spain | 11.6 /100 | #204 | Poor 45.8% |
| South American Indians | 11.5 /100 | #205 | Poor 45.8% |
| Immigrants | Immigrants | 11.2 /100 | #206 | Poor 45.8% |
| Immigrants | South America | 10.8 /100 | #207 | Poor 45.7% |
| Alsatians | 10.8 /100 | #208 | Poor 45.7% |
| Immigrants | Micronesia | 8.8 /100 | #209 | Tragic 45.6% |
| Uruguayans | 7.9 /100 | #210 | Tragic 45.6% |
| Houma | 7.2 /100 | #211 | Tragic 45.5% |
| Marshallese | 7.2 /100 | #212 | Tragic 45.5% |
| Alaska Natives | 7.0 /100 | #213 | Tragic 45.5% |
| Dutch West Indians | 6.7 /100 | #214 | Tragic 45.5% |
| German Russians | 6.7 /100 | #215 | Tragic 45.5% |
| Immigrants | Morocco | 5.5 /100 | #216 | Tragic 45.4% |
| Immigrants | Thailand | 5.1 /100 | #217 | Tragic 45.4% |
| Panamanians | 4.0 /100 | #218 | Tragic 45.3% |
| Immigrants | Portugal | 3.5 /100 | #219 | Tragic 45.2% |
| Kenyans | 3.1 /100 | #220 | Tragic 45.2% |
| Mexicans | 3.0 /100 | #221 | Tragic 45.2% |