Guatemalan vs Immigrants from Venezuela Currently Married
COMPARE
Guatemalan
Immigrants from Venezuela
Currently Married
Currently Married Comparison
Guatemalans
Immigrants from Venezuela
42.9%
CURRENTLY MARRIED
0.0/ 100
METRIC RATING
287th/ 347
METRIC RANK
47.0%
CURRENTLY MARRIED
68.6/ 100
METRIC RATING
153rd/ 347
METRIC RANK
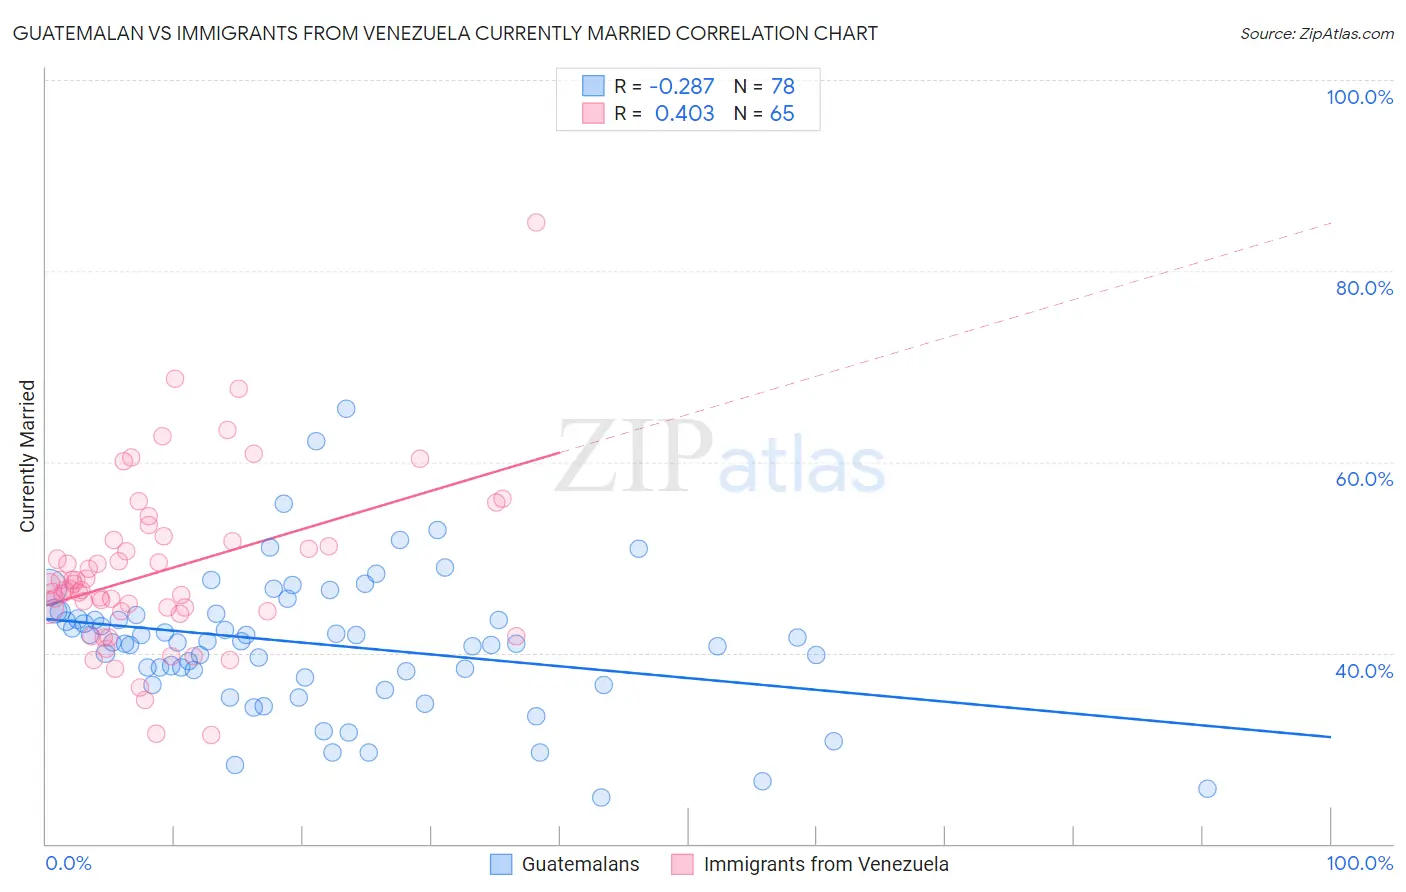
Guatemalan vs Immigrants from Venezuela Currently Married Correlation Chart
The statistical analysis conducted on geographies consisting of 409,507,416 people shows a weak negative correlation between the proportion of Guatemalans and percentage of population currently married in the United States with a correlation coefficient (R) of -0.287 and weighted average of 42.9%. Similarly, the statistical analysis conducted on geographies consisting of 287,838,026 people shows a moderate positive correlation between the proportion of Immigrants from Venezuela and percentage of population currently married in the United States with a correlation coefficient (R) of 0.403 and weighted average of 47.0%, a difference of 9.4%.
Currently Married Correlation Summary
| Measurement | Guatemalan | Immigrants from Venezuela |
| Minimum | 24.9% | 31.4% |
| Maximum | 65.6% | 85.1% |
| Range | 40.7% | 53.7% |
| Mean | 40.9% | 48.6% |
| Median | 41.1% | 46.7% |
| Interquartile 25% (IQ1) | 37.5% | 44.3% |
| Interquartile 75% (IQ3) | 44.0% | 51.7% |
| Interquartile Range (IQR) | 6.5% | 7.4% |
| Standard Deviation (Sample) | 7.3% | 9.0% |
| Standard Deviation (Population) | 7.2% | 8.9% |
Similar Demographics by Currently Married
Demographics Similar to Guatemalans by Currently Married
In terms of currently married, the demographic groups most similar to Guatemalans are Ghanaian (42.9%, a difference of 0.020%), Immigrants from Middle Africa (43.0%, a difference of 0.15%), Native/Alaskan (42.8%, a difference of 0.27%), Paiute (42.7%, a difference of 0.50%), and Immigrants from Ghana (42.7%, a difference of 0.51%).
| Demographics | Rating | Rank | Currently Married |
| Apache | 0.0 /100 | #280 | Tragic 43.2% |
| Chippewa | 0.0 /100 | #281 | Tragic 43.2% |
| Immigrants | Ecuador | 0.0 /100 | #282 | Tragic 43.2% |
| Kiowa | 0.0 /100 | #283 | Tragic 43.2% |
| Immigrants | El Salvador | 0.0 /100 | #284 | Tragic 43.1% |
| Immigrants | Middle Africa | 0.0 /100 | #285 | Tragic 43.0% |
| Ghanaians | 0.0 /100 | #286 | Tragic 42.9% |
| Guatemalans | 0.0 /100 | #287 | Tragic 42.9% |
| Natives/Alaskans | 0.0 /100 | #288 | Tragic 42.8% |
| Paiute | 0.0 /100 | #289 | Tragic 42.7% |
| Immigrants | Ghana | 0.0 /100 | #290 | Tragic 42.7% |
| Immigrants | Guatemala | 0.0 /100 | #291 | Tragic 42.6% |
| Sub-Saharan Africans | 0.0 /100 | #292 | Tragic 42.6% |
| Yuman | 0.0 /100 | #293 | Tragic 42.6% |
| Hondurans | 0.0 /100 | #294 | Tragic 42.5% |
Demographics Similar to Immigrants from Venezuela by Currently Married
In terms of currently married, the demographic groups most similar to Immigrants from Venezuela are Albanian (47.0%, a difference of 0.0%), Arab (47.0%, a difference of 0.0%), Immigrants from Serbia (47.0%, a difference of 0.010%), Spanish (47.0%, a difference of 0.020%), and Immigrants from Switzerland (46.9%, a difference of 0.030%).
| Demographics | Rating | Rank | Currently Married |
| Carpatho Rusyns | 72.6 /100 | #146 | Good 47.0% |
| Immigrants | Argentina | 72.0 /100 | #147 | Good 47.0% |
| Cambodians | 70.4 /100 | #148 | Good 47.0% |
| Zimbabweans | 70.1 /100 | #149 | Good 47.0% |
| Immigrants | Turkey | 70.0 /100 | #150 | Good 47.0% |
| Chileans | 69.8 /100 | #151 | Good 47.0% |
| Immigrants | Serbia | 68.8 /100 | #152 | Good 47.0% |
| Immigrants | Venezuela | 68.6 /100 | #153 | Good 47.0% |
| Albanians | 68.6 /100 | #154 | Good 47.0% |
| Arabs | 68.6 /100 | #155 | Good 47.0% |
| Spanish | 68.1 /100 | #156 | Good 47.0% |
| Immigrants | Switzerland | 67.8 /100 | #157 | Good 46.9% |
| Cherokee | 66.8 /100 | #158 | Good 46.9% |
| Iraqis | 66.4 /100 | #159 | Good 46.9% |
| Immigrants | Uzbekistan | 66.0 /100 | #160 | Good 46.9% |