Guatemalan vs South American Indian Currently Married
COMPARE
Guatemalan
South American Indian
Currently Married
Currently Married Comparison
Guatemalans
South American Indians
42.9%
CURRENTLY MARRIED
0.0/ 100
METRIC RATING
287th/ 347
METRIC RANK
45.8%
CURRENTLY MARRIED
11.5/ 100
METRIC RATING
205th/ 347
METRIC RANK
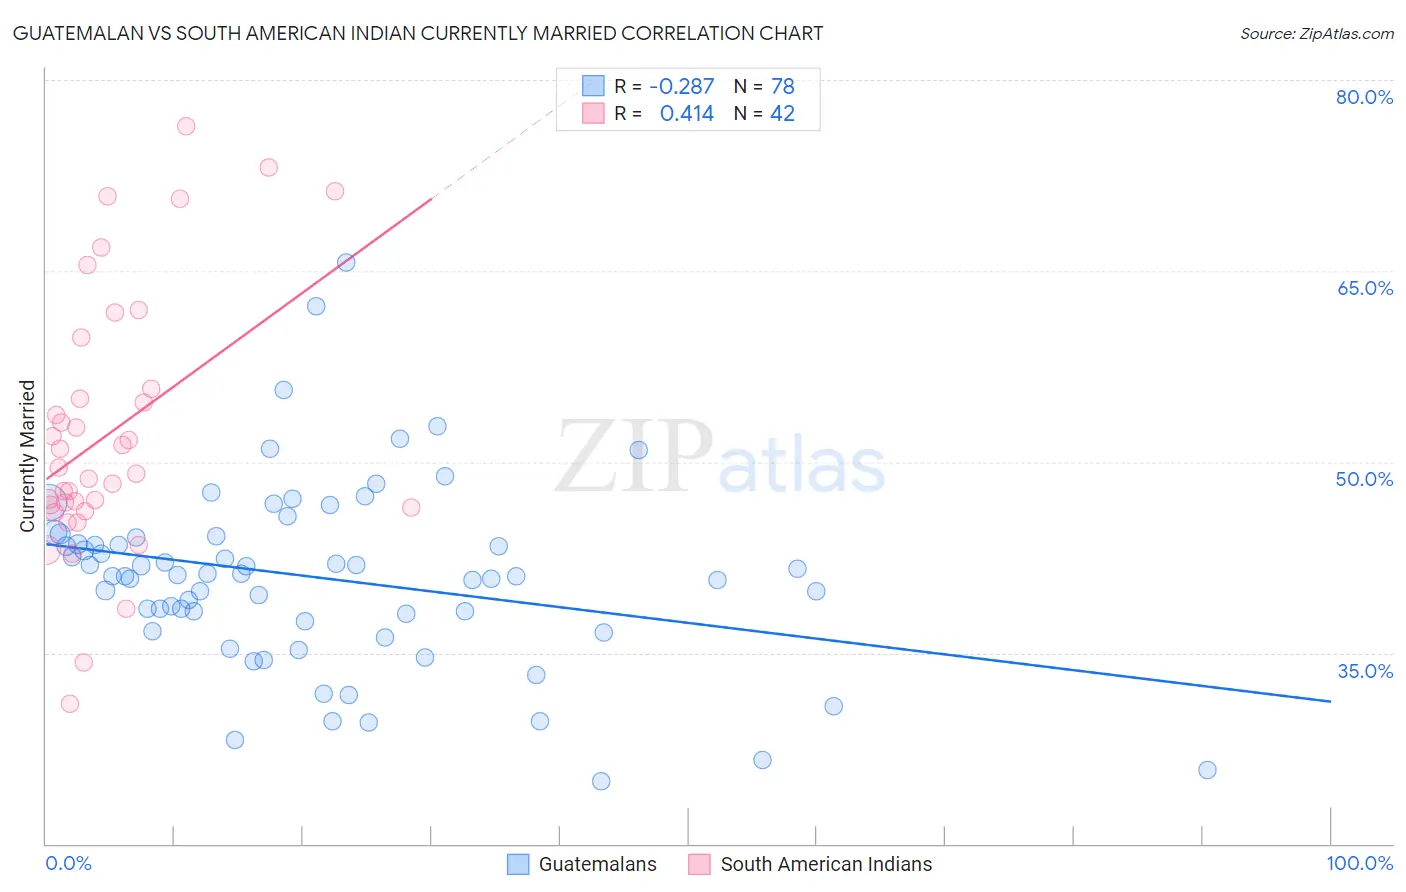
Guatemalan vs South American Indian Currently Married Correlation Chart
The statistical analysis conducted on geographies consisting of 409,507,416 people shows a weak negative correlation between the proportion of Guatemalans and percentage of population currently married in the United States with a correlation coefficient (R) of -0.287 and weighted average of 42.9%. Similarly, the statistical analysis conducted on geographies consisting of 164,571,412 people shows a moderate positive correlation between the proportion of South American Indians and percentage of population currently married in the United States with a correlation coefficient (R) of 0.414 and weighted average of 45.8%, a difference of 6.6%.
Currently Married Correlation Summary
| Measurement | Guatemalan | South American Indian |
| Minimum | 24.9% | 31.0% |
| Maximum | 65.6% | 76.4% |
| Range | 40.7% | 45.4% |
| Mean | 40.9% | 52.3% |
| Median | 41.1% | 49.3% |
| Interquartile 25% (IQ1) | 37.5% | 46.4% |
| Interquartile 75% (IQ3) | 44.0% | 55.7% |
| Interquartile Range (IQR) | 6.5% | 9.3% |
| Standard Deviation (Sample) | 7.3% | 10.3% |
| Standard Deviation (Population) | 7.2% | 10.2% |
Similar Demographics by Currently Married
Demographics Similar to Guatemalans by Currently Married
In terms of currently married, the demographic groups most similar to Guatemalans are Ghanaian (42.9%, a difference of 0.020%), Immigrants from Middle Africa (43.0%, a difference of 0.15%), Native/Alaskan (42.8%, a difference of 0.27%), Paiute (42.7%, a difference of 0.50%), and Immigrants from Ghana (42.7%, a difference of 0.51%).
| Demographics | Rating | Rank | Currently Married |
| Apache | 0.0 /100 | #280 | Tragic 43.2% |
| Chippewa | 0.0 /100 | #281 | Tragic 43.2% |
| Immigrants | Ecuador | 0.0 /100 | #282 | Tragic 43.2% |
| Kiowa | 0.0 /100 | #283 | Tragic 43.2% |
| Immigrants | El Salvador | 0.0 /100 | #284 | Tragic 43.1% |
| Immigrants | Middle Africa | 0.0 /100 | #285 | Tragic 43.0% |
| Ghanaians | 0.0 /100 | #286 | Tragic 42.9% |
| Guatemalans | 0.0 /100 | #287 | Tragic 42.9% |
| Natives/Alaskans | 0.0 /100 | #288 | Tragic 42.8% |
| Paiute | 0.0 /100 | #289 | Tragic 42.7% |
| Immigrants | Ghana | 0.0 /100 | #290 | Tragic 42.7% |
| Immigrants | Guatemala | 0.0 /100 | #291 | Tragic 42.6% |
| Sub-Saharan Africans | 0.0 /100 | #292 | Tragic 42.6% |
| Yuman | 0.0 /100 | #293 | Tragic 42.6% |
| Hondurans | 0.0 /100 | #294 | Tragic 42.5% |
Demographics Similar to South American Indians by Currently Married
In terms of currently married, the demographic groups most similar to South American Indians are Taiwanese (45.8%, a difference of 0.020%), Immigrants from Spain (45.8%, a difference of 0.020%), Immigrants (45.8%, a difference of 0.020%), Immigrants from South America (45.7%, a difference of 0.060%), and Alsatian (45.7%, a difference of 0.070%).
| Demographics | Rating | Rank | Currently Married |
| Immigrants | Colombia | 21.0 /100 | #198 | Fair 46.1% |
| Immigrants | Costa Rica | 19.6 /100 | #199 | Poor 46.0% |
| Creek | 17.2 /100 | #200 | Poor 46.0% |
| Malaysians | 15.3 /100 | #201 | Poor 45.9% |
| Immigrants | Albania | 14.5 /100 | #202 | Poor 45.9% |
| Taiwanese | 11.7 /100 | #203 | Poor 45.8% |
| Immigrants | Spain | 11.6 /100 | #204 | Poor 45.8% |
| South American Indians | 11.5 /100 | #205 | Poor 45.8% |
| Immigrants | Immigrants | 11.2 /100 | #206 | Poor 45.8% |
| Immigrants | South America | 10.8 /100 | #207 | Poor 45.7% |
| Alsatians | 10.8 /100 | #208 | Poor 45.7% |
| Immigrants | Micronesia | 8.8 /100 | #209 | Tragic 45.6% |
| Uruguayans | 7.9 /100 | #210 | Tragic 45.6% |
| Houma | 7.2 /100 | #211 | Tragic 45.5% |
| Marshallese | 7.2 /100 | #212 | Tragic 45.5% |