Guatemalan vs Sudanese Currently Married
COMPARE
Guatemalan
Sudanese
Currently Married
Currently Married Comparison
Guatemalans
Sudanese
42.9%
CURRENTLY MARRIED
0.0/ 100
METRIC RATING
287th/ 347
METRIC RANK
43.7%
CURRENTLY MARRIED
0.1/ 100
METRIC RATING
264th/ 347
METRIC RANK
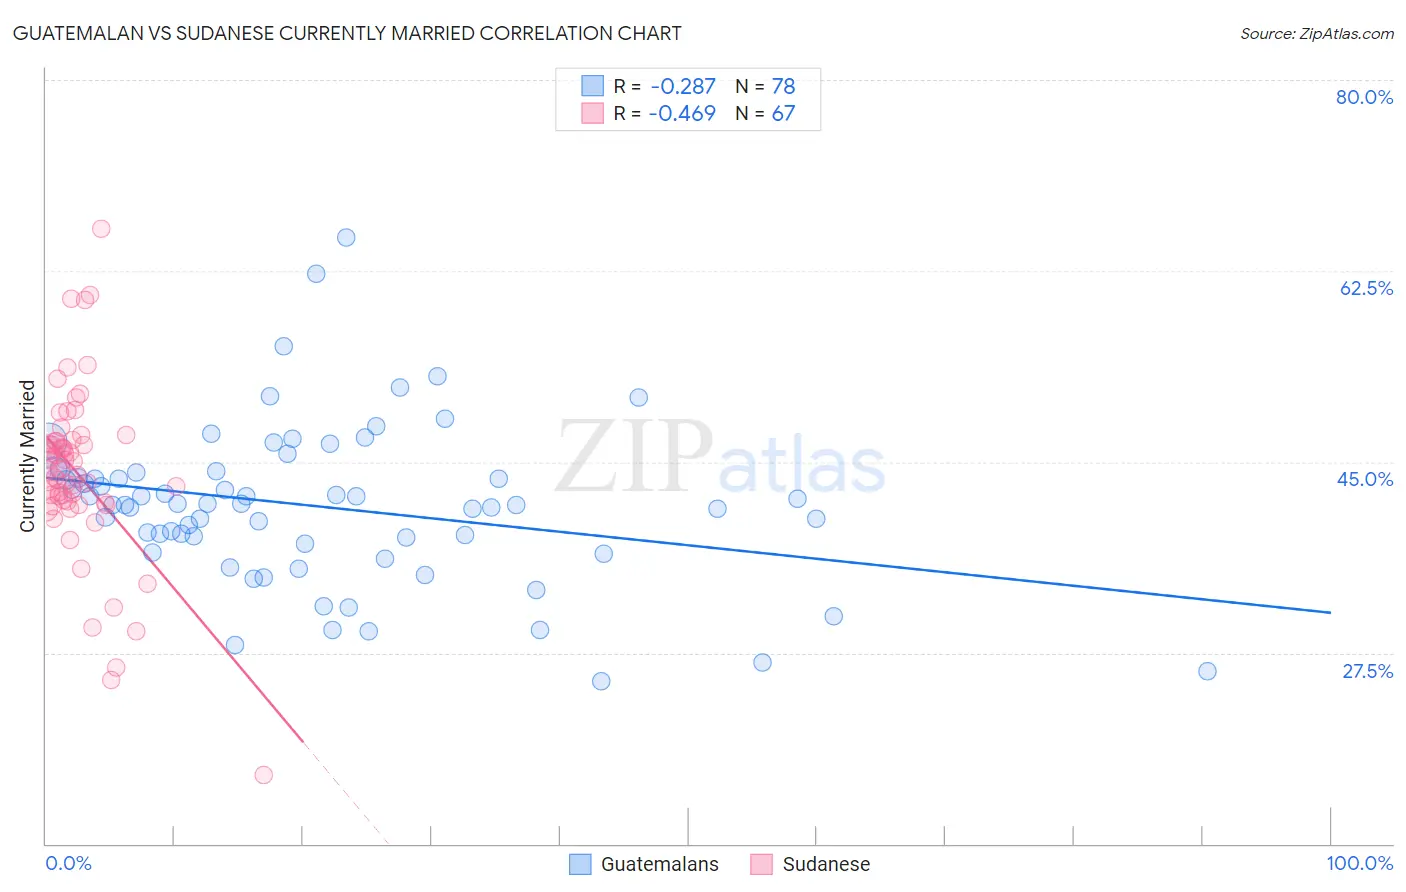
Guatemalan vs Sudanese Currently Married Correlation Chart
The statistical analysis conducted on geographies consisting of 409,507,416 people shows a weak negative correlation between the proportion of Guatemalans and percentage of population currently married in the United States with a correlation coefficient (R) of -0.287 and weighted average of 42.9%. Similarly, the statistical analysis conducted on geographies consisting of 110,133,540 people shows a moderate negative correlation between the proportion of Sudanese and percentage of population currently married in the United States with a correlation coefficient (R) of -0.469 and weighted average of 43.7%, a difference of 1.7%.
Currently Married Correlation Summary
| Measurement | Guatemalan | Sudanese |
| Minimum | 24.9% | 16.3% |
| Maximum | 65.6% | 66.4% |
| Range | 40.7% | 50.1% |
| Mean | 40.9% | 43.9% |
| Median | 41.1% | 44.3% |
| Interquartile 25% (IQ1) | 37.5% | 41.3% |
| Interquartile 75% (IQ3) | 44.0% | 46.9% |
| Interquartile Range (IQR) | 6.5% | 5.6% |
| Standard Deviation (Sample) | 7.3% | 8.0% |
| Standard Deviation (Population) | 7.2% | 7.9% |
Similar Demographics by Currently Married
Demographics Similar to Guatemalans by Currently Married
In terms of currently married, the demographic groups most similar to Guatemalans are Ghanaian (42.9%, a difference of 0.020%), Immigrants from Middle Africa (43.0%, a difference of 0.15%), Native/Alaskan (42.8%, a difference of 0.27%), Paiute (42.7%, a difference of 0.50%), and Immigrants from Ghana (42.7%, a difference of 0.51%).
| Demographics | Rating | Rank | Currently Married |
| Apache | 0.0 /100 | #280 | Tragic 43.2% |
| Chippewa | 0.0 /100 | #281 | Tragic 43.2% |
| Immigrants | Ecuador | 0.0 /100 | #282 | Tragic 43.2% |
| Kiowa | 0.0 /100 | #283 | Tragic 43.2% |
| Immigrants | El Salvador | 0.0 /100 | #284 | Tragic 43.1% |
| Immigrants | Middle Africa | 0.0 /100 | #285 | Tragic 43.0% |
| Ghanaians | 0.0 /100 | #286 | Tragic 42.9% |
| Guatemalans | 0.0 /100 | #287 | Tragic 42.9% |
| Natives/Alaskans | 0.0 /100 | #288 | Tragic 42.8% |
| Paiute | 0.0 /100 | #289 | Tragic 42.7% |
| Immigrants | Ghana | 0.0 /100 | #290 | Tragic 42.7% |
| Immigrants | Guatemala | 0.0 /100 | #291 | Tragic 42.6% |
| Sub-Saharan Africans | 0.0 /100 | #292 | Tragic 42.6% |
| Yuman | 0.0 /100 | #293 | Tragic 42.6% |
| Hondurans | 0.0 /100 | #294 | Tragic 42.5% |
Demographics Similar to Sudanese by Currently Married
In terms of currently married, the demographic groups most similar to Sudanese are Immigrants from Cuba (43.7%, a difference of 0.010%), Bangladeshi (43.7%, a difference of 0.050%), Immigrants from Bangladesh (43.6%, a difference of 0.080%), Ecuadorian (43.6%, a difference of 0.15%), and Immigrants from Eritrea (43.6%, a difference of 0.18%).
| Demographics | Rating | Rank | Currently Married |
| Immigrants | Africa | 0.2 /100 | #257 | Tragic 43.9% |
| Ute | 0.2 /100 | #258 | Tragic 43.9% |
| Immigrants | Sierra Leone | 0.1 /100 | #259 | Tragic 43.8% |
| Immigrants | Latin America | 0.1 /100 | #260 | Tragic 43.8% |
| Immigrants | Nicaragua | 0.1 /100 | #261 | Tragic 43.7% |
| Bangladeshis | 0.1 /100 | #262 | Tragic 43.7% |
| Immigrants | Cuba | 0.1 /100 | #263 | Tragic 43.7% |
| Sudanese | 0.1 /100 | #264 | Tragic 43.7% |
| Immigrants | Bangladesh | 0.1 /100 | #265 | Tragic 43.6% |
| Ecuadorians | 0.1 /100 | #266 | Tragic 43.6% |
| Immigrants | Eritrea | 0.1 /100 | #267 | Tragic 43.6% |
| Spanish American Indians | 0.1 /100 | #268 | Tragic 43.6% |
| Immigrants | Sudan | 0.1 /100 | #269 | Tragic 43.5% |
| Salvadorans | 0.1 /100 | #270 | Tragic 43.5% |
| Bermudans | 0.1 /100 | #271 | Tragic 43.5% |