Immigrants from Northern Africa vs Mexican Currently Married
COMPARE
Immigrants from Northern Africa
Mexican
Currently Married
Currently Married Comparison
Immigrants from Northern Africa
Mexicans
46.5%
CURRENTLY MARRIED
39.7/ 100
METRIC RATING
183rd/ 347
METRIC RANK
45.2%
CURRENTLY MARRIED
3.0/ 100
METRIC RATING
221st/ 347
METRIC RANK
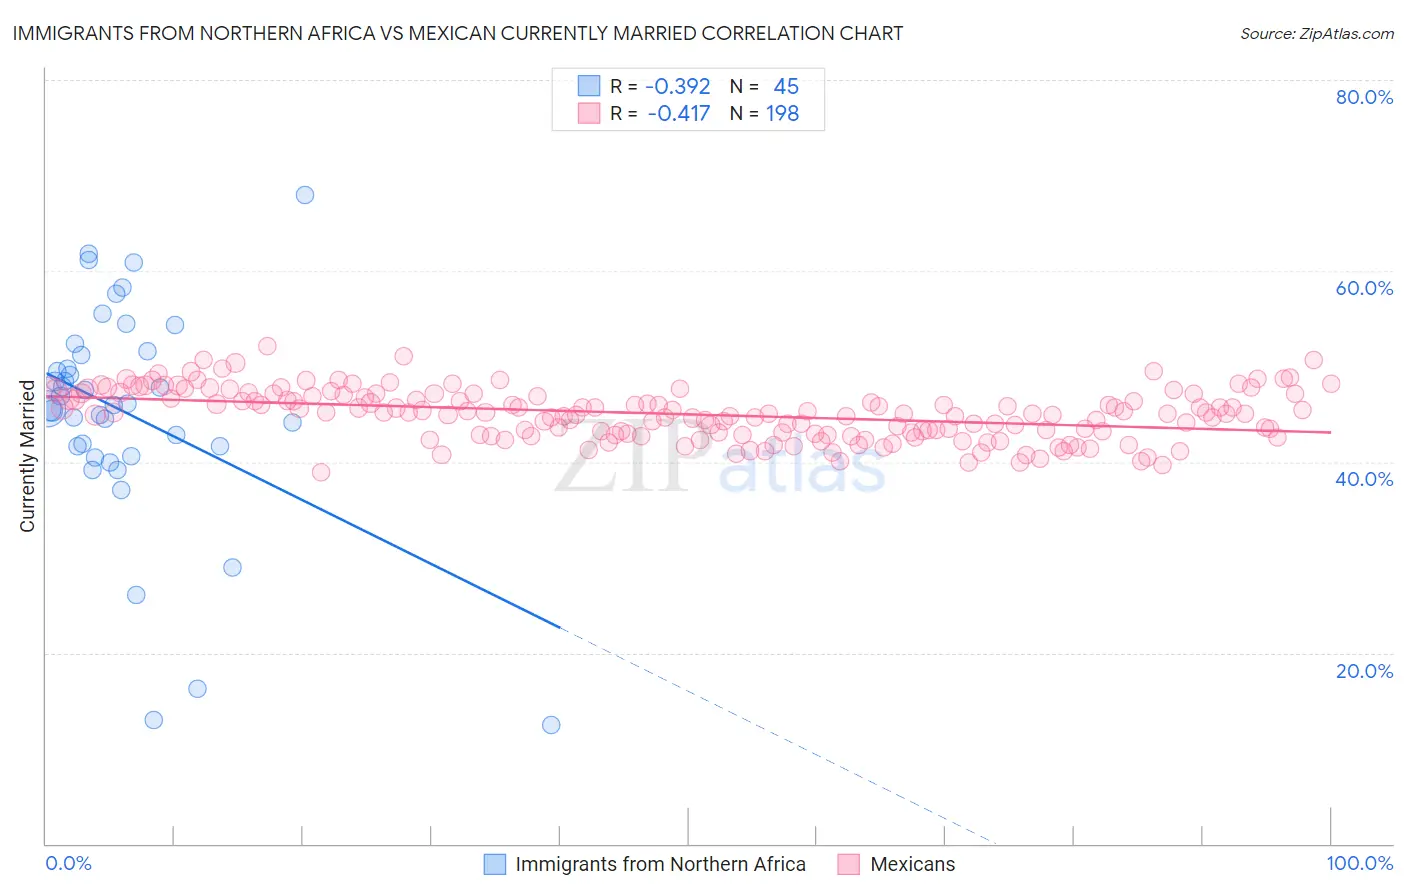
Immigrants from Northern Africa vs Mexican Currently Married Correlation Chart
The statistical analysis conducted on geographies consisting of 321,174,675 people shows a mild negative correlation between the proportion of Immigrants from Northern Africa and percentage of population currently married in the United States with a correlation coefficient (R) of -0.392 and weighted average of 46.5%. Similarly, the statistical analysis conducted on geographies consisting of 565,159,836 people shows a moderate negative correlation between the proportion of Mexicans and percentage of population currently married in the United States with a correlation coefficient (R) of -0.417 and weighted average of 45.2%, a difference of 2.9%.
Currently Married Correlation Summary
| Measurement | Immigrants from Northern Africa | Mexican |
| Minimum | 12.5% | 38.9% |
| Maximum | 67.9% | 52.1% |
| Range | 55.4% | 13.2% |
| Mean | 45.1% | 45.0% |
| Median | 45.9% | 45.1% |
| Interquartile 25% (IQ1) | 41.1% | 43.0% |
| Interquartile 75% (IQ3) | 51.4% | 47.1% |
| Interquartile Range (IQR) | 10.3% | 4.1% |
| Standard Deviation (Sample) | 11.6% | 2.6% |
| Standard Deviation (Population) | 11.5% | 2.6% |
Similar Demographics by Currently Married
Demographics Similar to Immigrants from Northern Africa by Currently Married
In terms of currently married, the demographic groups most similar to Immigrants from Northern Africa are Brazilian (46.4%, a difference of 0.020%), Potawatomi (46.5%, a difference of 0.080%), Mongolian (46.4%, a difference of 0.080%), Immigrants from Chile (46.4%, a difference of 0.11%), and Ottawa (46.5%, a difference of 0.13%).
| Demographics | Rating | Rank | Currently Married |
| Hawaiians | 48.6 /100 | #176 | Average 46.6% |
| Israelis | 48.6 /100 | #177 | Average 46.6% |
| Chickasaw | 47.8 /100 | #178 | Average 46.6% |
| Immigrants | Oceania | 44.6 /100 | #179 | Average 46.5% |
| Costa Ricans | 43.7 /100 | #180 | Average 46.5% |
| Ottawa | 43.0 /100 | #181 | Average 46.5% |
| Potawatomi | 41.9 /100 | #182 | Average 46.5% |
| Immigrants | Northern Africa | 39.7 /100 | #183 | Fair 46.5% |
| Brazilians | 39.3 /100 | #184 | Fair 46.4% |
| Mongolians | 37.6 /100 | #185 | Fair 46.4% |
| Immigrants | Chile | 36.8 /100 | #186 | Fair 46.4% |
| Immigrants | Peru | 35.3 /100 | #187 | Fair 46.4% |
| Colombians | 31.8 /100 | #188 | Fair 46.3% |
| Fijians | 30.3 /100 | #189 | Fair 46.3% |
| Choctaw | 29.1 /100 | #190 | Fair 46.3% |
Demographics Similar to Mexicans by Currently Married
In terms of currently married, the demographic groups most similar to Mexicans are Kenyan (45.2%, a difference of 0.020%), Immigrants from Portugal (45.2%, a difference of 0.14%), Immigrants from the Azores (45.1%, a difference of 0.20%), Panamanian (45.3%, a difference of 0.26%), and Immigrants from Laos (45.0%, a difference of 0.28%).
| Demographics | Rating | Rank | Currently Married |
| Dutch West Indians | 6.7 /100 | #214 | Tragic 45.5% |
| German Russians | 6.7 /100 | #215 | Tragic 45.5% |
| Immigrants | Morocco | 5.5 /100 | #216 | Tragic 45.4% |
| Immigrants | Thailand | 5.1 /100 | #217 | Tragic 45.4% |
| Panamanians | 4.0 /100 | #218 | Tragic 45.3% |
| Immigrants | Portugal | 3.5 /100 | #219 | Tragic 45.2% |
| Kenyans | 3.1 /100 | #220 | Tragic 45.2% |
| Mexicans | 3.0 /100 | #221 | Tragic 45.2% |
| Immigrants | Azores | 2.5 /100 | #222 | Tragic 45.1% |
| Immigrants | Laos | 2.3 /100 | #223 | Tragic 45.0% |
| Immigrants | Uganda | 2.2 /100 | #224 | Tragic 45.0% |
| French American Indians | 2.2 /100 | #225 | Tragic 45.0% |
| Comanche | 2.1 /100 | #226 | Tragic 45.0% |
| Spanish Americans | 2.1 /100 | #227 | Tragic 45.0% |
| Immigrants | Uruguay | 2.0 /100 | #228 | Tragic 45.0% |