Guatemalan vs Basque Currently Married
COMPARE
Guatemalan
Basque
Currently Married
Currently Married Comparison
Guatemalans
Basques
42.9%
CURRENTLY MARRIED
0.0/ 100
METRIC RATING
287th/ 347
METRIC RANK
48.1%
CURRENTLY MARRIED
97.2/ 100
METRIC RATING
76th/ 347
METRIC RANK
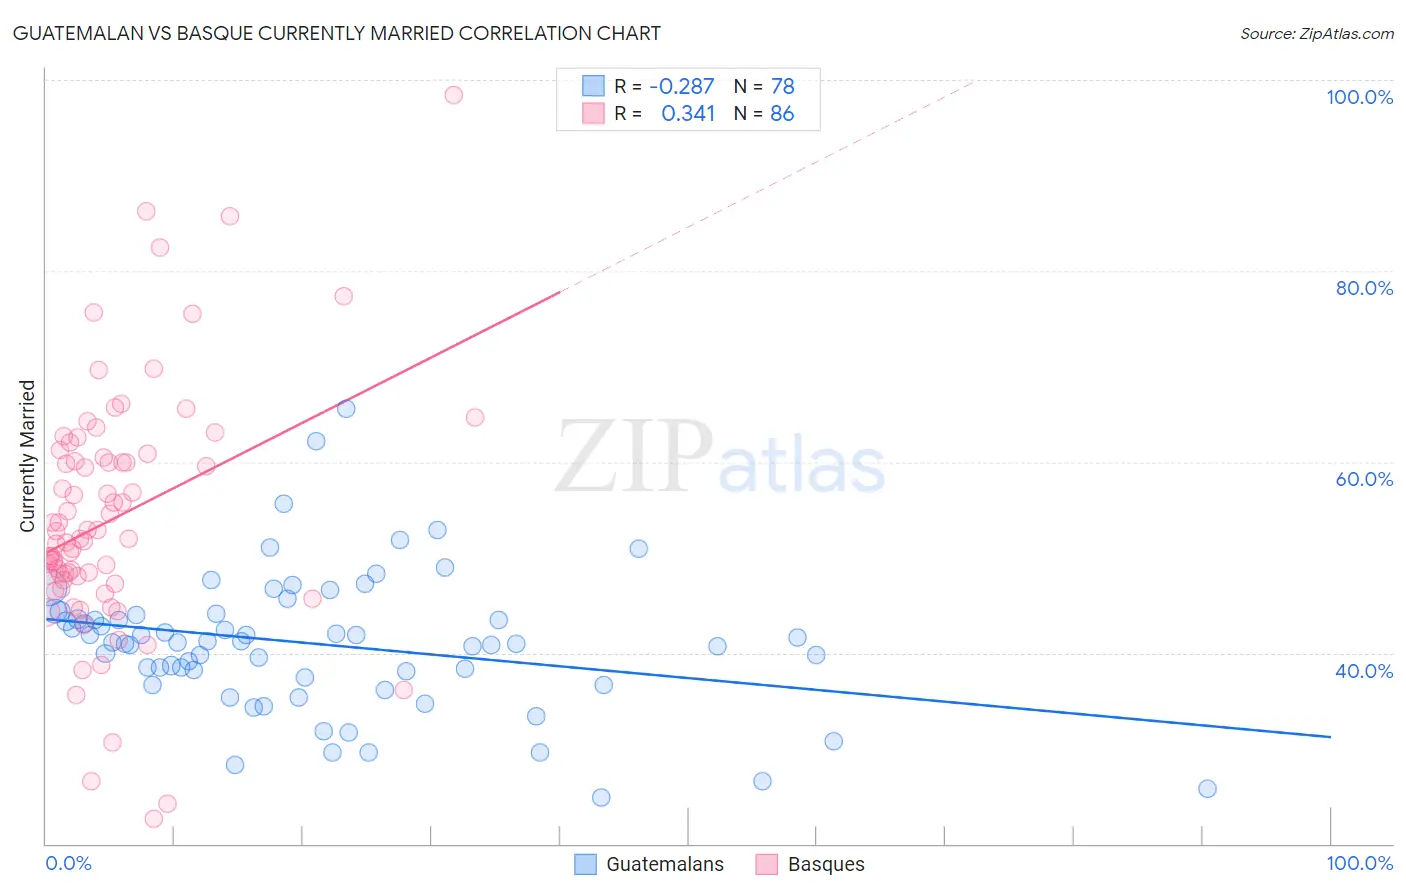
Guatemalan vs Basque Currently Married Correlation Chart
The statistical analysis conducted on geographies consisting of 409,507,416 people shows a weak negative correlation between the proportion of Guatemalans and percentage of population currently married in the United States with a correlation coefficient (R) of -0.287 and weighted average of 42.9%. Similarly, the statistical analysis conducted on geographies consisting of 165,765,037 people shows a mild positive correlation between the proportion of Basques and percentage of population currently married in the United States with a correlation coefficient (R) of 0.341 and weighted average of 48.1%, a difference of 12.2%.
Currently Married Correlation Summary
| Measurement | Guatemalan | Basque |
| Minimum | 24.9% | 22.6% |
| Maximum | 65.6% | 98.4% |
| Range | 40.7% | 75.8% |
| Mean | 40.9% | 54.1% |
| Median | 41.1% | 52.0% |
| Interquartile 25% (IQ1) | 37.5% | 47.6% |
| Interquartile 75% (IQ3) | 44.0% | 60.5% |
| Interquartile Range (IQR) | 6.5% | 12.9% |
| Standard Deviation (Sample) | 7.3% | 12.9% |
| Standard Deviation (Population) | 7.2% | 12.9% |
Similar Demographics by Currently Married
Demographics Similar to Guatemalans by Currently Married
In terms of currently married, the demographic groups most similar to Guatemalans are Ghanaian (42.9%, a difference of 0.020%), Immigrants from Middle Africa (43.0%, a difference of 0.15%), Native/Alaskan (42.8%, a difference of 0.27%), Paiute (42.7%, a difference of 0.50%), and Immigrants from Ghana (42.7%, a difference of 0.51%).
| Demographics | Rating | Rank | Currently Married |
| Apache | 0.0 /100 | #280 | Tragic 43.2% |
| Chippewa | 0.0 /100 | #281 | Tragic 43.2% |
| Immigrants | Ecuador | 0.0 /100 | #282 | Tragic 43.2% |
| Kiowa | 0.0 /100 | #283 | Tragic 43.2% |
| Immigrants | El Salvador | 0.0 /100 | #284 | Tragic 43.1% |
| Immigrants | Middle Africa | 0.0 /100 | #285 | Tragic 43.0% |
| Ghanaians | 0.0 /100 | #286 | Tragic 42.9% |
| Guatemalans | 0.0 /100 | #287 | Tragic 42.9% |
| Natives/Alaskans | 0.0 /100 | #288 | Tragic 42.8% |
| Paiute | 0.0 /100 | #289 | Tragic 42.7% |
| Immigrants | Ghana | 0.0 /100 | #290 | Tragic 42.7% |
| Immigrants | Guatemala | 0.0 /100 | #291 | Tragic 42.6% |
| Sub-Saharan Africans | 0.0 /100 | #292 | Tragic 42.6% |
| Yuman | 0.0 /100 | #293 | Tragic 42.6% |
| Hondurans | 0.0 /100 | #294 | Tragic 42.5% |
Demographics Similar to Basques by Currently Married
In terms of currently married, the demographic groups most similar to Basques are Immigrants from Belarus (48.1%, a difference of 0.020%), Slovene (48.1%, a difference of 0.020%), Immigrants from Belgium (48.1%, a difference of 0.030%), Immigrants from South Africa (48.1%, a difference of 0.040%), and Immigrants from Poland (48.1%, a difference of 0.080%).
| Demographics | Rating | Rank | Currently Married |
| Canadians | 98.1 /100 | #69 | Exceptional 48.3% |
| Immigrants | Asia | 97.9 /100 | #70 | Exceptional 48.3% |
| Macedonians | 97.9 /100 | #71 | Exceptional 48.3% |
| Immigrants | Lebanon | 97.6 /100 | #72 | Exceptional 48.2% |
| Immigrants | Eastern Asia | 97.5 /100 | #73 | Exceptional 48.2% |
| Estonians | 97.4 /100 | #74 | Exceptional 48.2% |
| Immigrants | Belarus | 97.2 /100 | #75 | Exceptional 48.1% |
| Basques | 97.2 /100 | #76 | Exceptional 48.1% |
| Slovenes | 97.1 /100 | #77 | Exceptional 48.1% |
| Immigrants | Belgium | 97.1 /100 | #78 | Exceptional 48.1% |
| Immigrants | South Africa | 97.0 /100 | #79 | Exceptional 48.1% |
| Immigrants | Poland | 96.9 /100 | #80 | Exceptional 48.1% |
| Immigrants | Sri Lanka | 96.9 /100 | #81 | Exceptional 48.1% |
| Immigrants | Europe | 96.9 /100 | #82 | Exceptional 48.1% |
| Bolivians | 96.9 /100 | #83 | Exceptional 48.1% |