Guatemalan vs Immigrants from Norway Single Father Households
COMPARE
Guatemalan
Immigrants from Norway
Single Father Households
Single Father Households Comparison
Guatemalans
Immigrants from Norway
3.0%
SINGLE FATHER HOUSEHOLDS
0.0/ 100
METRIC RATING
320th/ 347
METRIC RANK
2.0%
SINGLE FATHER HOUSEHOLDS
99.9/ 100
METRIC RATING
56th/ 347
METRIC RANK
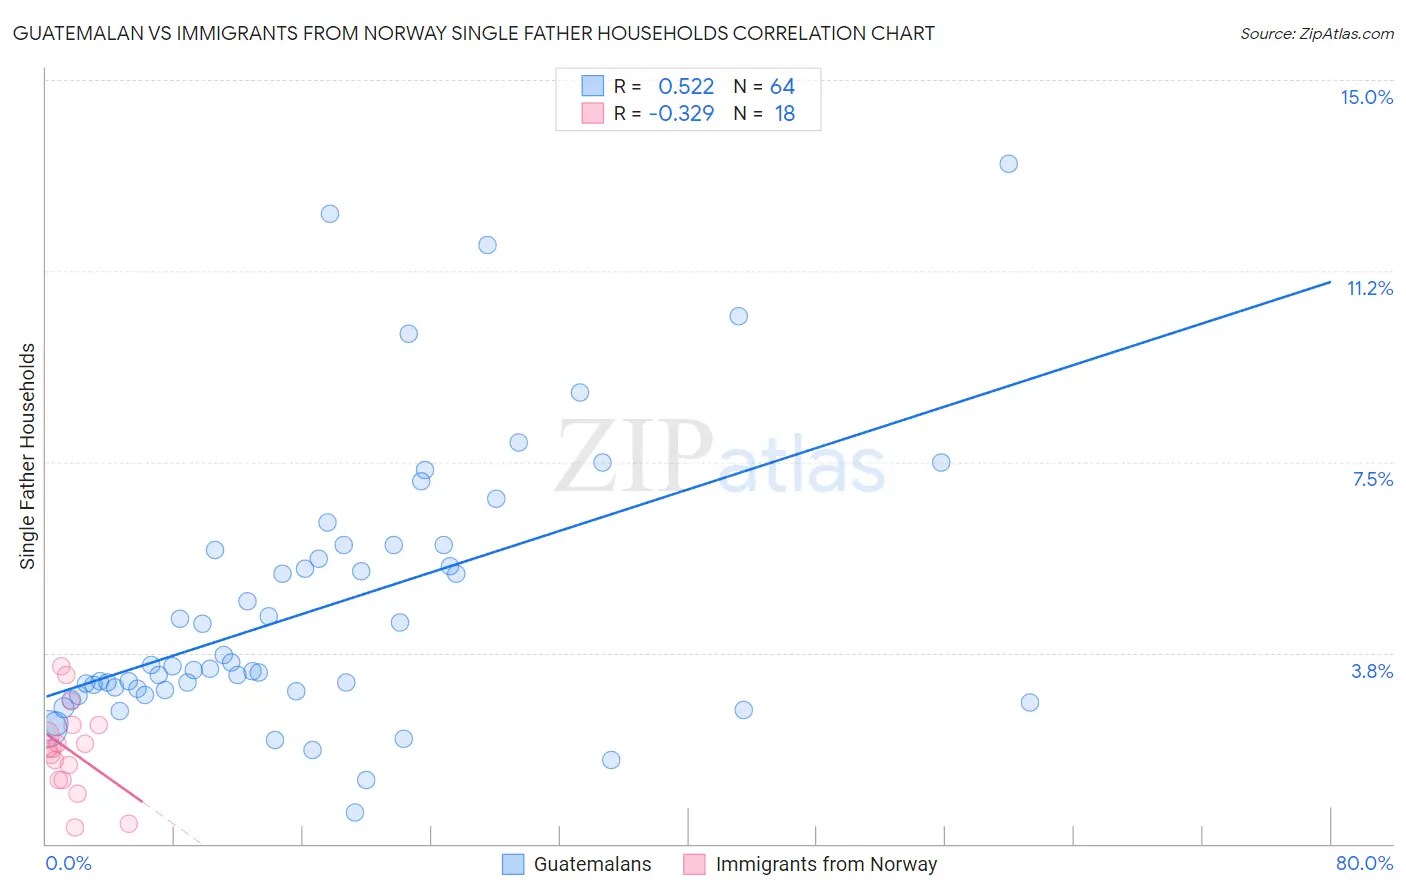
Guatemalan vs Immigrants from Norway Single Father Households Correlation Chart
The statistical analysis conducted on geographies consisting of 406,583,084 people shows a substantial positive correlation between the proportion of Guatemalans and percentage of single father households in the United States with a correlation coefficient (R) of 0.522 and weighted average of 3.0%. Similarly, the statistical analysis conducted on geographies consisting of 116,272,721 people shows a mild negative correlation between the proportion of Immigrants from Norway and percentage of single father households in the United States with a correlation coefficient (R) of -0.329 and weighted average of 2.0%, a difference of 46.2%.
Single Father Households Correlation Summary
| Measurement | Guatemalan | Immigrants from Norway |
| Minimum | 0.62% | 0.32% |
| Maximum | 13.4% | 3.5% |
| Range | 12.7% | 3.2% |
| Mean | 4.6% | 1.8% |
| Median | 3.5% | 1.9% |
| Interquartile 25% (IQ1) | 3.0% | 1.3% |
| Interquartile 75% (IQ3) | 5.8% | 2.3% |
| Interquartile Range (IQR) | 2.8% | 1.1% |
| Standard Deviation (Sample) | 2.7% | 0.85% |
| Standard Deviation (Population) | 2.7% | 0.83% |
Similar Demographics by Single Father Households
Demographics Similar to Guatemalans by Single Father Households
In terms of single father households, the demographic groups most similar to Guatemalans are Ute (3.0%, a difference of 0.080%), Mexican (3.0%, a difference of 0.39%), Cape Verdean (2.9%, a difference of 0.61%), Immigrants from El Salvador (2.9%, a difference of 0.62%), and Immigrants from Guatemala (3.0%, a difference of 0.92%).
| Demographics | Rating | Rank | Single Father Households |
| Arapaho | 0.0 /100 | #313 | Tragic 2.9% |
| Salvadorans | 0.0 /100 | #314 | Tragic 2.9% |
| Cheyenne | 0.0 /100 | #315 | Tragic 2.9% |
| Houma | 0.0 /100 | #316 | Tragic 2.9% |
| Immigrants | El Salvador | 0.0 /100 | #317 | Tragic 2.9% |
| Cape Verdeans | 0.0 /100 | #318 | Tragic 2.9% |
| Ute | 0.0 /100 | #319 | Tragic 3.0% |
| Guatemalans | 0.0 /100 | #320 | Tragic 3.0% |
| Mexicans | 0.0 /100 | #321 | Tragic 3.0% |
| Immigrants | Guatemala | 0.0 /100 | #322 | Tragic 3.0% |
| Immigrants | Central America | 0.0 /100 | #323 | Tragic 3.0% |
| Fijians | 0.0 /100 | #324 | Tragic 3.0% |
| Immigrants | Mexico | 0.0 /100 | #325 | Tragic 3.0% |
| Aleuts | 0.0 /100 | #326 | Tragic 3.0% |
| Bangladeshis | 0.0 /100 | #327 | Tragic 3.1% |
Demographics Similar to Immigrants from Norway by Single Father Households
In terms of single father households, the demographic groups most similar to Immigrants from Norway are Immigrants from France (2.0%, a difference of 0.020%), Immigrants from Korea (2.0%, a difference of 0.080%), Immigrants from Northern Europe (2.0%, a difference of 0.22%), Burmese (2.0%, a difference of 0.26%), and Immigrants from Czechoslovakia (2.0%, a difference of 0.29%).
| Demographics | Rating | Rank | Single Father Households |
| Immigrants | Serbia | 99.9 /100 | #49 | Exceptional 2.0% |
| Immigrants | Switzerland | 99.9 /100 | #50 | Exceptional 2.0% |
| Immigrants | Poland | 99.9 /100 | #51 | Exceptional 2.0% |
| Immigrants | Europe | 99.9 /100 | #52 | Exceptional 2.0% |
| Immigrants | Northern Europe | 99.9 /100 | #53 | Exceptional 2.0% |
| Immigrants | Korea | 99.9 /100 | #54 | Exceptional 2.0% |
| Immigrants | France | 99.9 /100 | #55 | Exceptional 2.0% |
| Immigrants | Norway | 99.9 /100 | #56 | Exceptional 2.0% |
| Burmese | 99.9 /100 | #57 | Exceptional 2.0% |
| Immigrants | Czechoslovakia | 99.9 /100 | #58 | Exceptional 2.0% |
| Immigrants | North Macedonia | 99.9 /100 | #59 | Exceptional 2.0% |
| Immigrants | Austria | 99.9 /100 | #60 | Exceptional 2.0% |
| Vietnamese | 99.9 /100 | #61 | Exceptional 2.0% |
| Immigrants | Malaysia | 99.9 /100 | #62 | Exceptional 2.0% |
| Maltese | 99.9 /100 | #63 | Exceptional 2.0% |