Guatemalan vs Jordanian Single Father Households
COMPARE
Guatemalan
Jordanian
Single Father Households
Single Father Households Comparison
Guatemalans
Jordanians
3.0%
SINGLE FATHER HOUSEHOLDS
0.0/ 100
METRIC RATING
320th/ 347
METRIC RANK
2.2%
SINGLE FATHER HOUSEHOLDS
96.9/ 100
METRIC RATING
127th/ 347
METRIC RANK
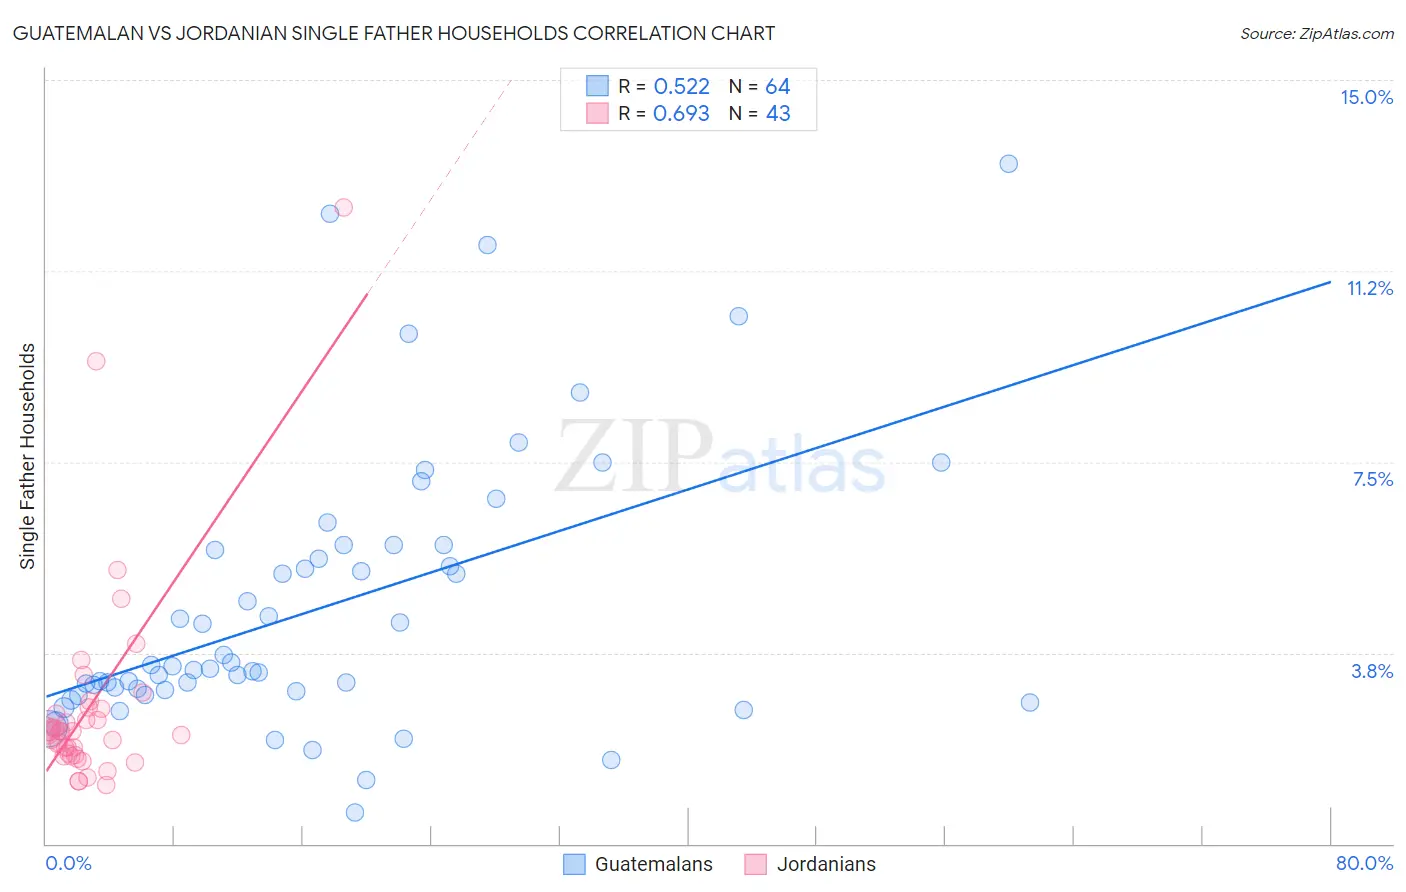
Guatemalan vs Jordanian Single Father Households Correlation Chart
The statistical analysis conducted on geographies consisting of 406,583,084 people shows a substantial positive correlation between the proportion of Guatemalans and percentage of single father households in the United States with a correlation coefficient (R) of 0.522 and weighted average of 3.0%. Similarly, the statistical analysis conducted on geographies consisting of 165,930,664 people shows a significant positive correlation between the proportion of Jordanians and percentage of single father households in the United States with a correlation coefficient (R) of 0.693 and weighted average of 2.2%, a difference of 35.4%.
Single Father Households Correlation Summary
| Measurement | Guatemalan | Jordanian |
| Minimum | 0.62% | 1.1% |
| Maximum | 13.4% | 12.5% |
| Range | 12.7% | 11.4% |
| Mean | 4.6% | 2.7% |
| Median | 3.5% | 2.2% |
| Interquartile 25% (IQ1) | 3.0% | 1.7% |
| Interquartile 75% (IQ3) | 5.8% | 2.6% |
| Interquartile Range (IQR) | 2.8% | 0.89% |
| Standard Deviation (Sample) | 2.7% | 2.1% |
| Standard Deviation (Population) | 2.7% | 2.0% |
Similar Demographics by Single Father Households
Demographics Similar to Guatemalans by Single Father Households
In terms of single father households, the demographic groups most similar to Guatemalans are Ute (3.0%, a difference of 0.080%), Mexican (3.0%, a difference of 0.39%), Cape Verdean (2.9%, a difference of 0.61%), Immigrants from El Salvador (2.9%, a difference of 0.62%), and Immigrants from Guatemala (3.0%, a difference of 0.92%).
| Demographics | Rating | Rank | Single Father Households |
| Arapaho | 0.0 /100 | #313 | Tragic 2.9% |
| Salvadorans | 0.0 /100 | #314 | Tragic 2.9% |
| Cheyenne | 0.0 /100 | #315 | Tragic 2.9% |
| Houma | 0.0 /100 | #316 | Tragic 2.9% |
| Immigrants | El Salvador | 0.0 /100 | #317 | Tragic 2.9% |
| Cape Verdeans | 0.0 /100 | #318 | Tragic 2.9% |
| Ute | 0.0 /100 | #319 | Tragic 3.0% |
| Guatemalans | 0.0 /100 | #320 | Tragic 3.0% |
| Mexicans | 0.0 /100 | #321 | Tragic 3.0% |
| Immigrants | Guatemala | 0.0 /100 | #322 | Tragic 3.0% |
| Immigrants | Central America | 0.0 /100 | #323 | Tragic 3.0% |
| Fijians | 0.0 /100 | #324 | Tragic 3.0% |
| Immigrants | Mexico | 0.0 /100 | #325 | Tragic 3.0% |
| Aleuts | 0.0 /100 | #326 | Tragic 3.0% |
| Bangladeshis | 0.0 /100 | #327 | Tragic 3.1% |
Demographics Similar to Jordanians by Single Father Households
In terms of single father households, the demographic groups most similar to Jordanians are Moroccan (2.2%, a difference of 0.0%), Immigrants from England (2.2%, a difference of 0.040%), Serbian (2.2%, a difference of 0.050%), Immigrants from Chile (2.2%, a difference of 0.17%), and Immigrants from Jordan (2.2%, a difference of 0.23%).
| Demographics | Rating | Rank | Single Father Households |
| Australians | 97.7 /100 | #120 | Exceptional 2.2% |
| Immigrants | Brazil | 97.7 /100 | #121 | Exceptional 2.2% |
| Immigrants | Iraq | 97.6 /100 | #122 | Exceptional 2.2% |
| Immigrants | Yemen | 97.5 /100 | #123 | Exceptional 2.2% |
| British West Indians | 97.4 /100 | #124 | Exceptional 2.2% |
| Immigrants | Indonesia | 97.4 /100 | #125 | Exceptional 2.2% |
| Moroccans | 96.9 /100 | #126 | Exceptional 2.2% |
| Jordanians | 96.9 /100 | #127 | Exceptional 2.2% |
| Immigrants | England | 96.8 /100 | #128 | Exceptional 2.2% |
| Serbians | 96.8 /100 | #129 | Exceptional 2.2% |
| Immigrants | Chile | 96.7 /100 | #130 | Exceptional 2.2% |
| Immigrants | Jordan | 96.6 /100 | #131 | Exceptional 2.2% |
| Poles | 96.5 /100 | #132 | Exceptional 2.2% |
| Taiwanese | 96.3 /100 | #133 | Exceptional 2.2% |
| Zimbabweans | 95.1 /100 | #134 | Exceptional 2.2% |