British West Indian vs Immigrants from Norway Single Father Households
COMPARE
British West Indian
Immigrants from Norway
Single Father Households
Single Father Households Comparison
British West Indians
Immigrants from Norway
2.2%
SINGLE FATHER HOUSEHOLDS
97.4/ 100
METRIC RATING
124th/ 347
METRIC RANK
2.0%
SINGLE FATHER HOUSEHOLDS
99.9/ 100
METRIC RATING
56th/ 347
METRIC RANK
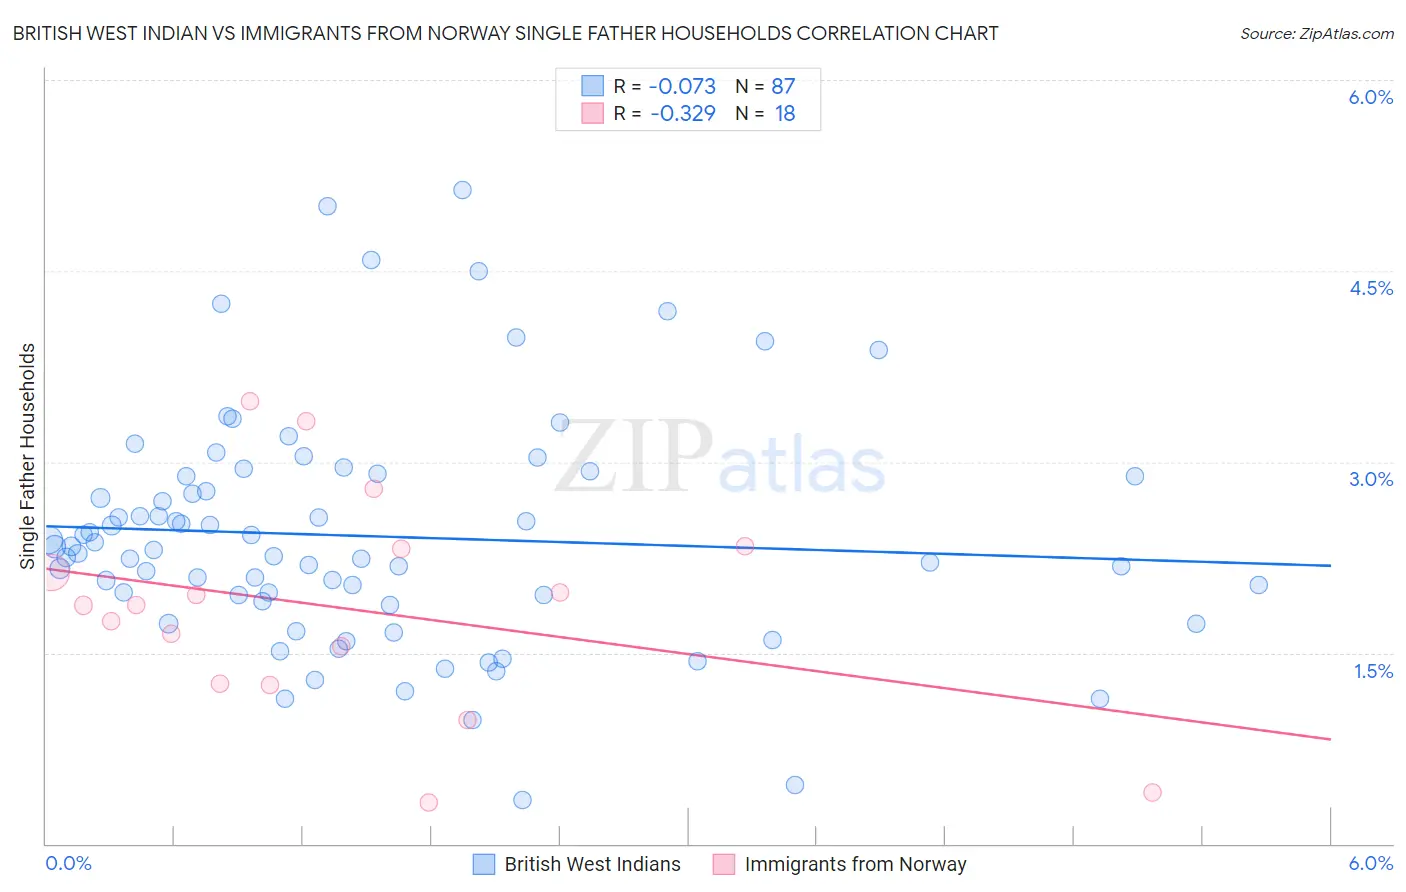
British West Indian vs Immigrants from Norway Single Father Households Correlation Chart
The statistical analysis conducted on geographies consisting of 152,266,714 people shows a slight negative correlation between the proportion of British West Indians and percentage of single father households in the United States with a correlation coefficient (R) of -0.073 and weighted average of 2.2%. Similarly, the statistical analysis conducted on geographies consisting of 116,272,721 people shows a mild negative correlation between the proportion of Immigrants from Norway and percentage of single father households in the United States with a correlation coefficient (R) of -0.329 and weighted average of 2.0%, a difference of 7.6%.
Single Father Households Correlation Summary
| Measurement | British West Indian | Immigrants from Norway |
| Minimum | 0.35% | 0.32% |
| Maximum | 5.1% | 3.5% |
| Range | 4.8% | 3.2% |
| Mean | 2.4% | 1.8% |
| Median | 2.3% | 1.9% |
| Interquartile 25% (IQ1) | 1.9% | 1.3% |
| Interquartile 75% (IQ3) | 2.9% | 2.3% |
| Interquartile Range (IQR) | 0.98% | 1.1% |
| Standard Deviation (Sample) | 0.92% | 0.85% |
| Standard Deviation (Population) | 0.91% | 0.83% |
Similar Demographics by Single Father Households
Demographics Similar to British West Indians by Single Father Households
In terms of single father households, the demographic groups most similar to British West Indians are Immigrants from Yemen (2.2%, a difference of 0.020%), Immigrants from Indonesia (2.2%, a difference of 0.050%), Immigrants from Iraq (2.2%, a difference of 0.17%), Australian (2.2%, a difference of 0.27%), and Immigrants from Brazil (2.2%, a difference of 0.27%).
| Demographics | Rating | Rank | Single Father Households |
| Hungarians | 97.9 /100 | #117 | Exceptional 2.2% |
| Immigrants | Morocco | 97.8 /100 | #118 | Exceptional 2.2% |
| Trinidadians and Tobagonians | 97.8 /100 | #119 | Exceptional 2.2% |
| Australians | 97.7 /100 | #120 | Exceptional 2.2% |
| Immigrants | Brazil | 97.7 /100 | #121 | Exceptional 2.2% |
| Immigrants | Iraq | 97.6 /100 | #122 | Exceptional 2.2% |
| Immigrants | Yemen | 97.5 /100 | #123 | Exceptional 2.2% |
| British West Indians | 97.4 /100 | #124 | Exceptional 2.2% |
| Immigrants | Indonesia | 97.4 /100 | #125 | Exceptional 2.2% |
| Moroccans | 96.9 /100 | #126 | Exceptional 2.2% |
| Jordanians | 96.9 /100 | #127 | Exceptional 2.2% |
| Immigrants | England | 96.8 /100 | #128 | Exceptional 2.2% |
| Serbians | 96.8 /100 | #129 | Exceptional 2.2% |
| Immigrants | Chile | 96.7 /100 | #130 | Exceptional 2.2% |
| Immigrants | Jordan | 96.6 /100 | #131 | Exceptional 2.2% |
Demographics Similar to Immigrants from Norway by Single Father Households
In terms of single father households, the demographic groups most similar to Immigrants from Norway are Immigrants from France (2.0%, a difference of 0.020%), Immigrants from Korea (2.0%, a difference of 0.080%), Immigrants from Northern Europe (2.0%, a difference of 0.22%), Burmese (2.0%, a difference of 0.26%), and Immigrants from Czechoslovakia (2.0%, a difference of 0.29%).
| Demographics | Rating | Rank | Single Father Households |
| Immigrants | Serbia | 99.9 /100 | #49 | Exceptional 2.0% |
| Immigrants | Switzerland | 99.9 /100 | #50 | Exceptional 2.0% |
| Immigrants | Poland | 99.9 /100 | #51 | Exceptional 2.0% |
| Immigrants | Europe | 99.9 /100 | #52 | Exceptional 2.0% |
| Immigrants | Northern Europe | 99.9 /100 | #53 | Exceptional 2.0% |
| Immigrants | Korea | 99.9 /100 | #54 | Exceptional 2.0% |
| Immigrants | France | 99.9 /100 | #55 | Exceptional 2.0% |
| Immigrants | Norway | 99.9 /100 | #56 | Exceptional 2.0% |
| Burmese | 99.9 /100 | #57 | Exceptional 2.0% |
| Immigrants | Czechoslovakia | 99.9 /100 | #58 | Exceptional 2.0% |
| Immigrants | North Macedonia | 99.9 /100 | #59 | Exceptional 2.0% |
| Immigrants | Austria | 99.9 /100 | #60 | Exceptional 2.0% |
| Vietnamese | 99.9 /100 | #61 | Exceptional 2.0% |
| Immigrants | Malaysia | 99.9 /100 | #62 | Exceptional 2.0% |
| Maltese | 99.9 /100 | #63 | Exceptional 2.0% |