Egyptian vs Immigrants from Norway Single Father Households
COMPARE
Egyptian
Immigrants from Norway
Single Father Households
Single Father Households Comparison
Egyptians
Immigrants from Norway
2.1%
SINGLE FATHER HOUSEHOLDS
99.8/ 100
METRIC RATING
70th/ 347
METRIC RANK
2.0%
SINGLE FATHER HOUSEHOLDS
99.9/ 100
METRIC RATING
56th/ 347
METRIC RANK
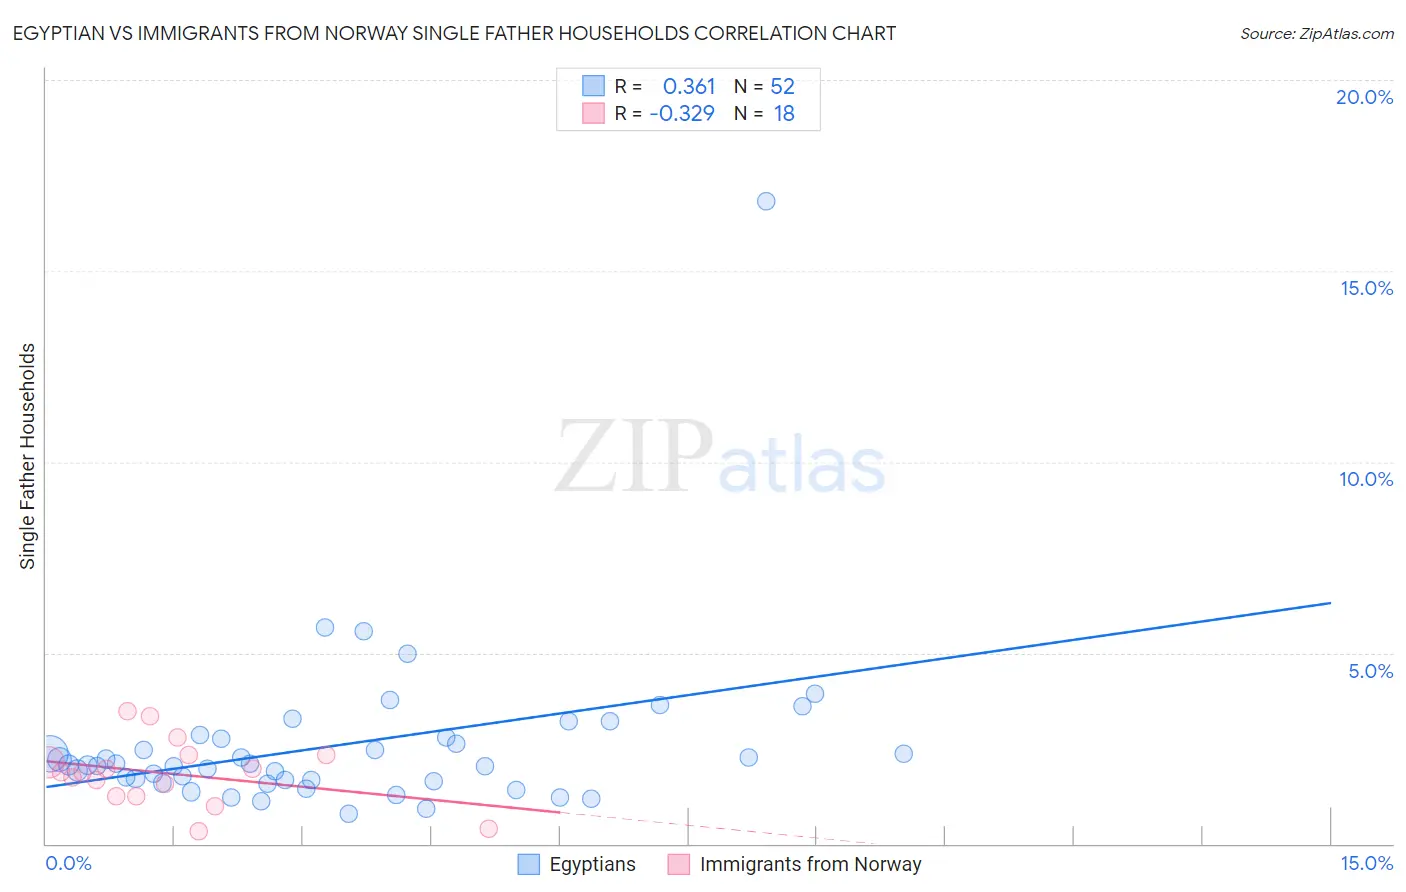
Egyptian vs Immigrants from Norway Single Father Households Correlation Chart
The statistical analysis conducted on geographies consisting of 275,347,548 people shows a mild positive correlation between the proportion of Egyptians and percentage of single father households in the United States with a correlation coefficient (R) of 0.361 and weighted average of 2.1%. Similarly, the statistical analysis conducted on geographies consisting of 116,272,721 people shows a mild negative correlation between the proportion of Immigrants from Norway and percentage of single father households in the United States with a correlation coefficient (R) of -0.329 and weighted average of 2.0%, a difference of 1.9%.
Single Father Households Correlation Summary
| Measurement | Egyptian | Immigrants from Norway |
| Minimum | 0.77% | 0.32% |
| Maximum | 16.8% | 3.5% |
| Range | 16.1% | 3.2% |
| Mean | 2.6% | 1.8% |
| Median | 2.1% | 1.9% |
| Interquartile 25% (IQ1) | 1.7% | 1.3% |
| Interquartile 75% (IQ3) | 2.8% | 2.3% |
| Interquartile Range (IQR) | 1.1% | 1.1% |
| Standard Deviation (Sample) | 2.3% | 0.85% |
| Standard Deviation (Population) | 2.3% | 0.83% |
Demographics Similar to Egyptians and Immigrants from Norway by Single Father Households
In terms of single father households, the demographic groups most similar to Egyptians are Immigrants from Kuwait (2.1%, a difference of 0.010%), Immigrants from Spain (2.1%, a difference of 0.020%), Immigrants from Bangladesh (2.1%, a difference of 0.16%), Immigrants from Romania (2.1%, a difference of 0.21%), and Immigrants from Denmark (2.1%, a difference of 0.23%). Similarly, the demographic groups most similar to Immigrants from Norway are Immigrants from France (2.0%, a difference of 0.020%), Immigrants from Korea (2.0%, a difference of 0.080%), Immigrants from Northern Europe (2.0%, a difference of 0.22%), Burmese (2.0%, a difference of 0.26%), and Immigrants from Czechoslovakia (2.0%, a difference of 0.29%).
| Demographics | Rating | Rank | Single Father Households |
| Immigrants | Northern Europe | 99.9 /100 | #53 | Exceptional 2.0% |
| Immigrants | Korea | 99.9 /100 | #54 | Exceptional 2.0% |
| Immigrants | France | 99.9 /100 | #55 | Exceptional 2.0% |
| Immigrants | Norway | 99.9 /100 | #56 | Exceptional 2.0% |
| Burmese | 99.9 /100 | #57 | Exceptional 2.0% |
| Immigrants | Czechoslovakia | 99.9 /100 | #58 | Exceptional 2.0% |
| Immigrants | North Macedonia | 99.9 /100 | #59 | Exceptional 2.0% |
| Immigrants | Austria | 99.9 /100 | #60 | Exceptional 2.0% |
| Vietnamese | 99.9 /100 | #61 | Exceptional 2.0% |
| Immigrants | Malaysia | 99.9 /100 | #62 | Exceptional 2.0% |
| Maltese | 99.9 /100 | #63 | Exceptional 2.0% |
| Mongolians | 99.9 /100 | #64 | Exceptional 2.1% |
| Paraguayans | 99.9 /100 | #65 | Exceptional 2.1% |
| Immigrants | Western Asia | 99.8 /100 | #66 | Exceptional 2.1% |
| Immigrants | Italy | 99.8 /100 | #67 | Exceptional 2.1% |
| Immigrants | Denmark | 99.8 /100 | #68 | Exceptional 2.1% |
| Immigrants | Romania | 99.8 /100 | #69 | Exceptional 2.1% |
| Egyptians | 99.8 /100 | #70 | Exceptional 2.1% |
| Immigrants | Kuwait | 99.8 /100 | #71 | Exceptional 2.1% |
| Immigrants | Spain | 99.8 /100 | #72 | Exceptional 2.1% |
| Immigrants | Bangladesh | 99.8 /100 | #73 | Exceptional 2.1% |