Guatemalan vs Belgian Single Father Households
COMPARE
Guatemalan
Belgian
Single Father Households
Single Father Households Comparison
Guatemalans
Belgians
3.0%
SINGLE FATHER HOUSEHOLDS
0.0/ 100
METRIC RATING
320th/ 347
METRIC RANK
2.3%
SINGLE FATHER HOUSEHOLDS
43.3/ 100
METRIC RATING
182nd/ 347
METRIC RANK
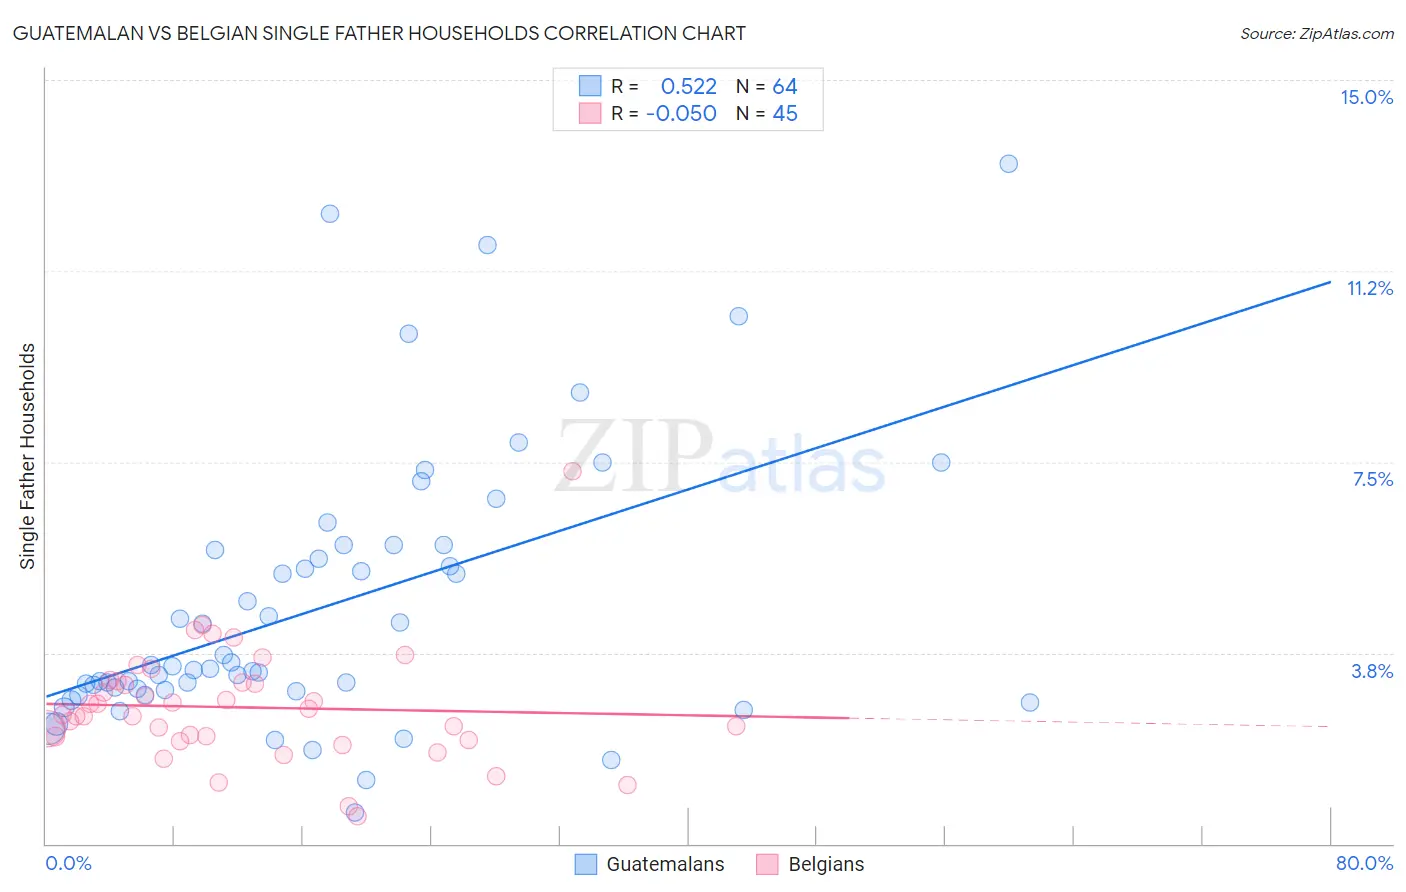
Guatemalan vs Belgian Single Father Households Correlation Chart
The statistical analysis conducted on geographies consisting of 406,583,084 people shows a substantial positive correlation between the proportion of Guatemalans and percentage of single father households in the United States with a correlation coefficient (R) of 0.522 and weighted average of 3.0%. Similarly, the statistical analysis conducted on geographies consisting of 352,865,149 people shows a slight negative correlation between the proportion of Belgians and percentage of single father households in the United States with a correlation coefficient (R) of -0.050 and weighted average of 2.3%, a difference of 26.2%.
Single Father Households Correlation Summary
| Measurement | Guatemalan | Belgian |
| Minimum | 0.62% | 0.55% |
| Maximum | 13.4% | 7.3% |
| Range | 12.7% | 6.8% |
| Mean | 4.6% | 2.7% |
| Median | 3.5% | 2.5% |
| Interquartile 25% (IQ1) | 3.0% | 2.1% |
| Interquartile 75% (IQ3) | 5.8% | 3.2% |
| Interquartile Range (IQR) | 2.8% | 1.1% |
| Standard Deviation (Sample) | 2.7% | 1.1% |
| Standard Deviation (Population) | 2.7% | 1.1% |
Similar Demographics by Single Father Households
Demographics Similar to Guatemalans by Single Father Households
In terms of single father households, the demographic groups most similar to Guatemalans are Ute (3.0%, a difference of 0.080%), Mexican (3.0%, a difference of 0.39%), Cape Verdean (2.9%, a difference of 0.61%), Immigrants from El Salvador (2.9%, a difference of 0.62%), and Immigrants from Guatemala (3.0%, a difference of 0.92%).
| Demographics | Rating | Rank | Single Father Households |
| Arapaho | 0.0 /100 | #313 | Tragic 2.9% |
| Salvadorans | 0.0 /100 | #314 | Tragic 2.9% |
| Cheyenne | 0.0 /100 | #315 | Tragic 2.9% |
| Houma | 0.0 /100 | #316 | Tragic 2.9% |
| Immigrants | El Salvador | 0.0 /100 | #317 | Tragic 2.9% |
| Cape Verdeans | 0.0 /100 | #318 | Tragic 2.9% |
| Ute | 0.0 /100 | #319 | Tragic 3.0% |
| Guatemalans | 0.0 /100 | #320 | Tragic 3.0% |
| Mexicans | 0.0 /100 | #321 | Tragic 3.0% |
| Immigrants | Guatemala | 0.0 /100 | #322 | Tragic 3.0% |
| Immigrants | Central America | 0.0 /100 | #323 | Tragic 3.0% |
| Fijians | 0.0 /100 | #324 | Tragic 3.0% |
| Immigrants | Mexico | 0.0 /100 | #325 | Tragic 3.0% |
| Aleuts | 0.0 /100 | #326 | Tragic 3.0% |
| Bangladeshis | 0.0 /100 | #327 | Tragic 3.1% |
Demographics Similar to Belgians by Single Father Households
In terms of single father households, the demographic groups most similar to Belgians are Jamaican (2.3%, a difference of 0.020%), Yugoslavian (2.3%, a difference of 0.040%), Costa Rican (2.3%, a difference of 0.060%), Welsh (2.3%, a difference of 0.060%), and Immigrants from Panama (2.4%, a difference of 0.11%).
| Demographics | Rating | Rank | Single Father Households |
| Immigrants | Jamaica | 49.1 /100 | #175 | Average 2.3% |
| Danes | 48.2 /100 | #176 | Average 2.3% |
| Colombians | 48.0 /100 | #177 | Average 2.3% |
| Costa Ricans | 44.1 /100 | #178 | Average 2.3% |
| Welsh | 44.0 /100 | #179 | Average 2.3% |
| Yugoslavians | 43.9 /100 | #180 | Average 2.3% |
| Jamaicans | 43.5 /100 | #181 | Average 2.3% |
| Belgians | 43.3 /100 | #182 | Average 2.3% |
| Immigrants | Panama | 41.8 /100 | #183 | Average 2.4% |
| Sri Lankans | 41.8 /100 | #184 | Average 2.4% |
| Nigerians | 41.0 /100 | #185 | Average 2.4% |
| Immigrants | Bosnia and Herzegovina | 40.4 /100 | #186 | Average 2.4% |
| Immigrants | Colombia | 34.0 /100 | #187 | Fair 2.4% |
| Hmong | 33.0 /100 | #188 | Fair 2.4% |
| U.S. Virgin Islanders | 31.8 /100 | #189 | Fair 2.4% |