Guatemalan vs Immigrants from Norway Median Household Income
COMPARE
Guatemalan
Immigrants from Norway
Median Household Income
Median Household Income Comparison
Guatemalans
Immigrants from Norway
$75,961
MEDIAN HOUSEHOLD INCOME
0.3/ 100
METRIC RATING
264th/ 347
METRIC RANK
$94,846
MEDIAN HOUSEHOLD INCOME
99.8/ 100
METRIC RATING
62nd/ 347
METRIC RANK
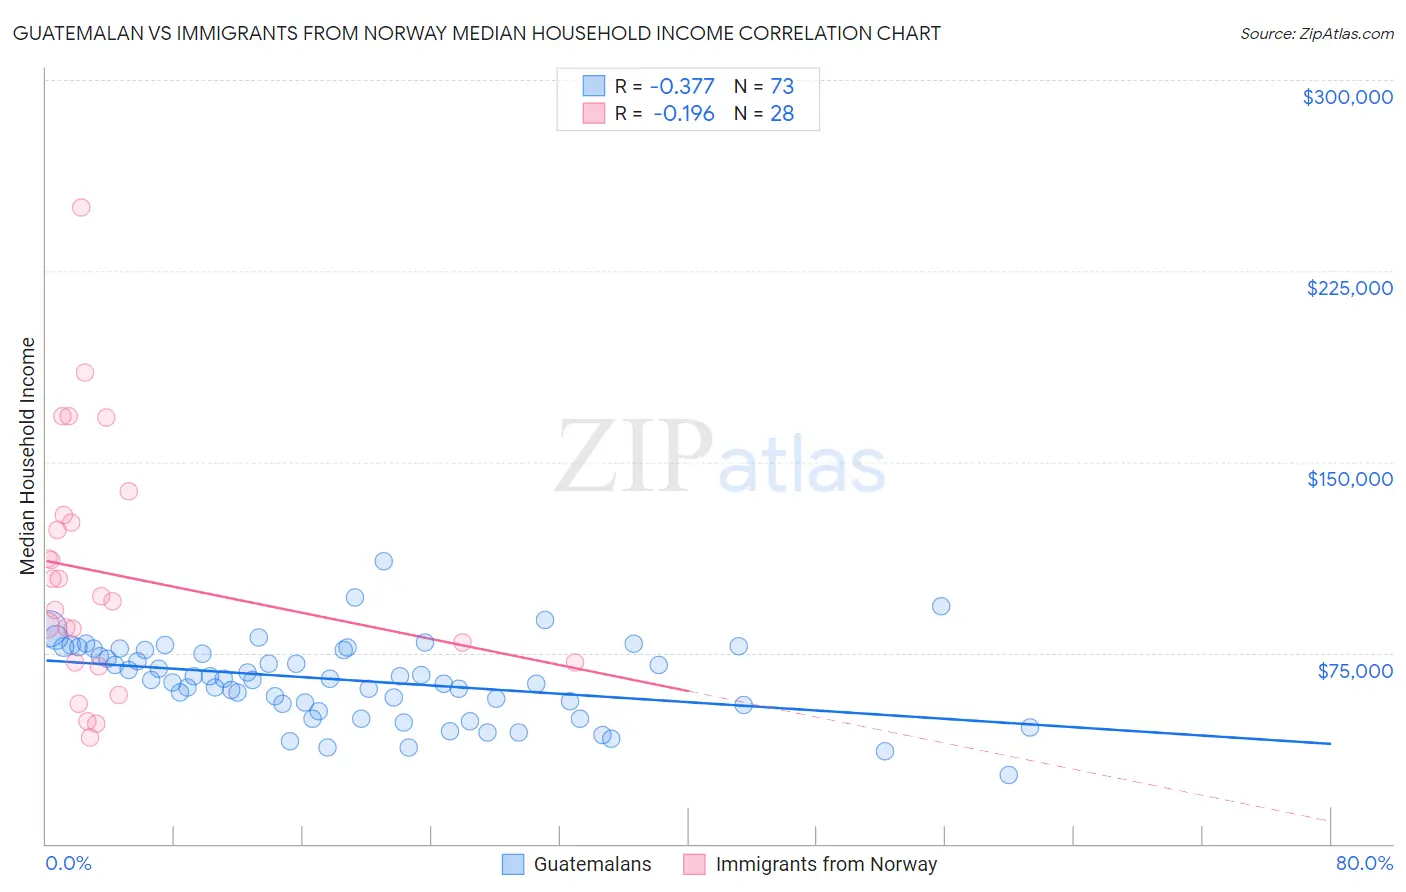
Guatemalan vs Immigrants from Norway Median Household Income Correlation Chart
The statistical analysis conducted on geographies consisting of 409,198,651 people shows a mild negative correlation between the proportion of Guatemalans and median household income in the United States with a correlation coefficient (R) of -0.377 and weighted average of $75,961. Similarly, the statistical analysis conducted on geographies consisting of 116,683,199 people shows a poor negative correlation between the proportion of Immigrants from Norway and median household income in the United States with a correlation coefficient (R) of -0.196 and weighted average of $94,846, a difference of 24.9%.
Median Household Income Correlation Summary
| Measurement | Guatemalan | Immigrants from Norway |
| Minimum | $26,979 | $41,875 |
| Maximum | $111,004 | $250,001 |
| Range | $84,025 | $208,126 |
| Mean | $64,179 | $106,024 |
| Median | $64,652 | $96,218 |
| Interquartile 25% (IQ1) | $54,709 | $71,155 |
| Interquartile 75% (IQ3) | $76,221 | $127,785 |
| Interquartile Range (IQR) | $21,512 | $56,630 |
| Standard Deviation (Sample) | $15,411 | $48,243 |
| Standard Deviation (Population) | $15,305 | $47,374 |
Similar Demographics by Median Household Income
Demographics Similar to Guatemalans by Median Household Income
In terms of median household income, the demographic groups most similar to Guatemalans are Immigrants from Belize ($75,938, a difference of 0.030%), American ($75,932, a difference of 0.040%), German Russian ($75,856, a difference of 0.14%), Immigrants from Jamaica ($75,851, a difference of 0.15%), and Cape Verdean ($75,848, a difference of 0.15%).
| Demographics | Rating | Rank | Median Household Income |
| Immigrants | Senegal | 0.5 /100 | #257 | Tragic $76,915 |
| Immigrants | Nicaragua | 0.5 /100 | #258 | Tragic $76,784 |
| Spanish American Indians | 0.4 /100 | #259 | Tragic $76,670 |
| Jamaicans | 0.4 /100 | #260 | Tragic $76,583 |
| Immigrants | Grenada | 0.4 /100 | #261 | Tragic $76,517 |
| French American Indians | 0.4 /100 | #262 | Tragic $76,387 |
| Alaskan Athabascans | 0.4 /100 | #263 | Tragic $76,383 |
| Guatemalans | 0.3 /100 | #264 | Tragic $75,961 |
| Immigrants | Belize | 0.3 /100 | #265 | Tragic $75,938 |
| Americans | 0.3 /100 | #266 | Tragic $75,932 |
| German Russians | 0.3 /100 | #267 | Tragic $75,856 |
| Immigrants | Jamaica | 0.3 /100 | #268 | Tragic $75,851 |
| Cape Verdeans | 0.3 /100 | #269 | Tragic $75,848 |
| Hmong | 0.3 /100 | #270 | Tragic $75,839 |
| Pennsylvania Germans | 0.3 /100 | #271 | Tragic $75,814 |
Demographics Similar to Immigrants from Norway by Median Household Income
In terms of median household income, the demographic groups most similar to Immigrants from Norway are Greek ($94,735, a difference of 0.12%), Laotian ($94,990, a difference of 0.15%), Korean ($95,018, a difference of 0.18%), Immigrants from Europe ($95,032, a difference of 0.20%), and Soviet Union ($95,098, a difference of 0.27%).
| Demographics | Rating | Rank | Median Household Income |
| Immigrants | Czechoslovakia | 99.9 /100 | #55 | Exceptional $95,319 |
| Immigrants | Austria | 99.9 /100 | #56 | Exceptional $95,277 |
| New Zealanders | 99.8 /100 | #57 | Exceptional $95,146 |
| Soviet Union | 99.8 /100 | #58 | Exceptional $95,098 |
| Immigrants | Europe | 99.8 /100 | #59 | Exceptional $95,032 |
| Koreans | 99.8 /100 | #60 | Exceptional $95,018 |
| Laotians | 99.8 /100 | #61 | Exceptional $94,990 |
| Immigrants | Norway | 99.8 /100 | #62 | Exceptional $94,846 |
| Greeks | 99.8 /100 | #63 | Exceptional $94,735 |
| Immigrants | Netherlands | 99.7 /100 | #64 | Exceptional $94,411 |
| Immigrants | Belarus | 99.7 /100 | #65 | Exceptional $94,399 |
| Immigrants | Romania | 99.7 /100 | #66 | Exceptional $94,222 |
| Immigrants | Scotland | 99.7 /100 | #67 | Exceptional $94,091 |
| Mongolians | 99.7 /100 | #68 | Exceptional $93,971 |
| Argentineans | 99.7 /100 | #69 | Exceptional $93,960 |