Guatemalan vs Immigrants from Caribbean Single Father Households
COMPARE
Guatemalan
Immigrants from Caribbean
Single Father Households
Single Father Households Comparison
Guatemalans
Immigrants from Caribbean
3.0%
SINGLE FATHER HOUSEHOLDS
0.0/ 100
METRIC RATING
320th/ 347
METRIC RANK
2.5%
SINGLE FATHER HOUSEHOLDS
1.0/ 100
METRIC RATING
260th/ 347
METRIC RANK
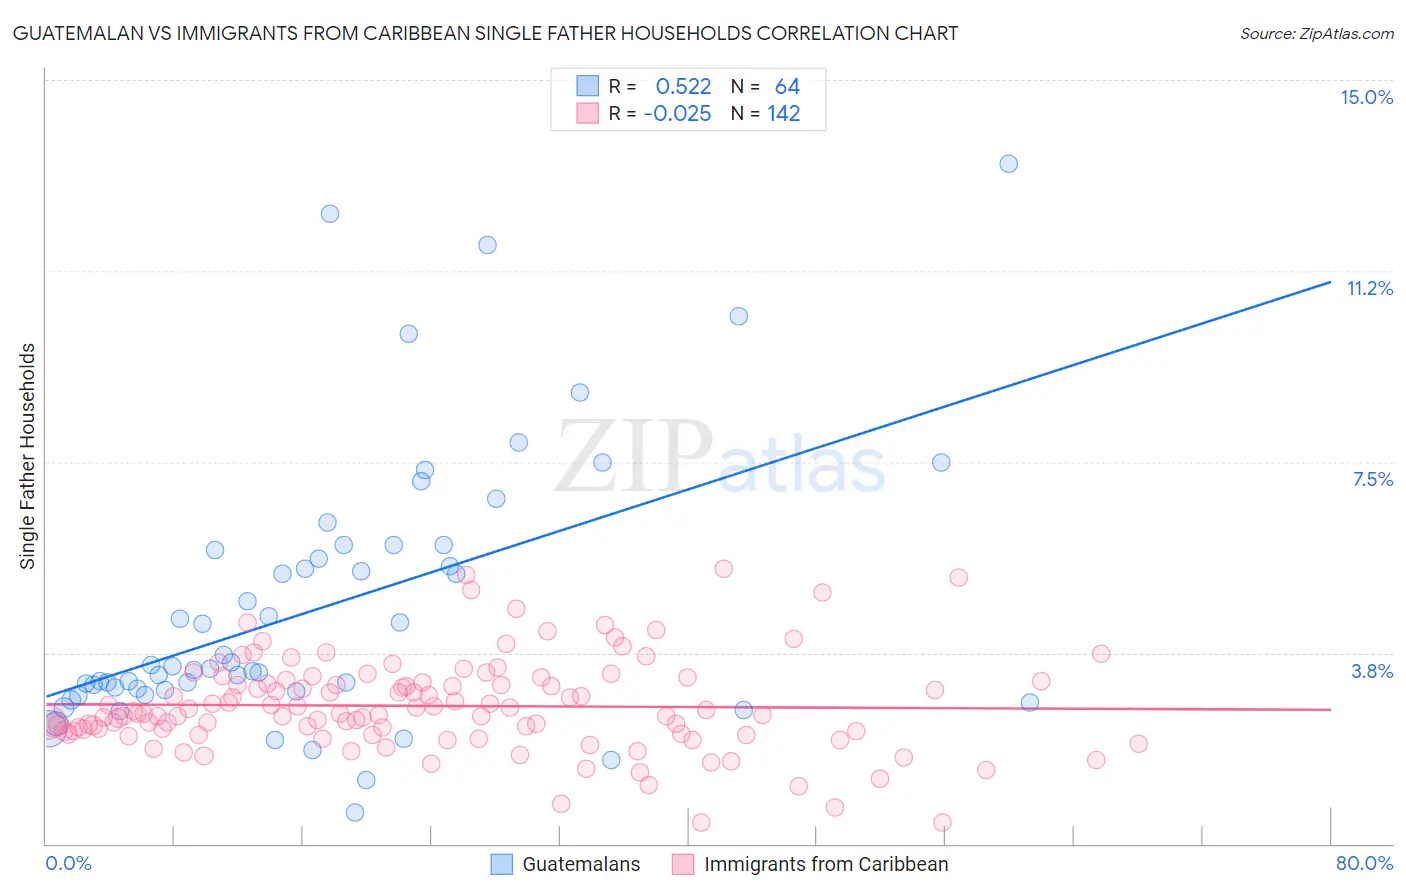
Guatemalan vs Immigrants from Caribbean Single Father Households Correlation Chart
The statistical analysis conducted on geographies consisting of 406,583,084 people shows a substantial positive correlation between the proportion of Guatemalans and percentage of single father households in the United States with a correlation coefficient (R) of 0.522 and weighted average of 3.0%. Similarly, the statistical analysis conducted on geographies consisting of 444,658,168 people shows no correlation between the proportion of Immigrants from Caribbean and percentage of single father households in the United States with a correlation coefficient (R) of -0.025 and weighted average of 2.5%, a difference of 16.9%.
Single Father Households Correlation Summary
| Measurement | Guatemalan | Immigrants from Caribbean |
| Minimum | 0.62% | 0.41% |
| Maximum | 13.4% | 5.4% |
| Range | 12.7% | 5.0% |
| Mean | 4.6% | 2.7% |
| Median | 3.5% | 2.6% |
| Interquartile 25% (IQ1) | 3.0% | 2.2% |
| Interquartile 75% (IQ3) | 5.8% | 3.2% |
| Interquartile Range (IQR) | 2.8% | 0.95% |
| Standard Deviation (Sample) | 2.7% | 0.91% |
| Standard Deviation (Population) | 2.7% | 0.91% |
Similar Demographics by Single Father Households
Demographics Similar to Guatemalans by Single Father Households
In terms of single father households, the demographic groups most similar to Guatemalans are Ute (3.0%, a difference of 0.080%), Mexican (3.0%, a difference of 0.39%), Cape Verdean (2.9%, a difference of 0.61%), Immigrants from El Salvador (2.9%, a difference of 0.62%), and Immigrants from Guatemala (3.0%, a difference of 0.92%).
| Demographics | Rating | Rank | Single Father Households |
| Arapaho | 0.0 /100 | #313 | Tragic 2.9% |
| Salvadorans | 0.0 /100 | #314 | Tragic 2.9% |
| Cheyenne | 0.0 /100 | #315 | Tragic 2.9% |
| Houma | 0.0 /100 | #316 | Tragic 2.9% |
| Immigrants | El Salvador | 0.0 /100 | #317 | Tragic 2.9% |
| Cape Verdeans | 0.0 /100 | #318 | Tragic 2.9% |
| Ute | 0.0 /100 | #319 | Tragic 3.0% |
| Guatemalans | 0.0 /100 | #320 | Tragic 3.0% |
| Mexicans | 0.0 /100 | #321 | Tragic 3.0% |
| Immigrants | Guatemala | 0.0 /100 | #322 | Tragic 3.0% |
| Immigrants | Central America | 0.0 /100 | #323 | Tragic 3.0% |
| Fijians | 0.0 /100 | #324 | Tragic 3.0% |
| Immigrants | Mexico | 0.0 /100 | #325 | Tragic 3.0% |
| Aleuts | 0.0 /100 | #326 | Tragic 3.0% |
| Bangladeshis | 0.0 /100 | #327 | Tragic 3.1% |
Demographics Similar to Immigrants from Caribbean by Single Father Households
In terms of single father households, the demographic groups most similar to Immigrants from Caribbean are Comanche (2.5%, a difference of 0.090%), Immigrants from Belize (2.5%, a difference of 0.16%), Spanish (2.5%, a difference of 0.24%), Immigrants from Liberia (2.5%, a difference of 0.31%), and Immigrants from Congo (2.5%, a difference of 0.33%).
| Demographics | Rating | Rank | Single Father Households |
| Immigrants | Somalia | 1.9 /100 | #253 | Tragic 2.5% |
| Immigrants | Thailand | 1.8 /100 | #254 | Tragic 2.5% |
| Tongans | 1.5 /100 | #255 | Tragic 2.5% |
| Potawatomi | 1.4 /100 | #256 | Tragic 2.5% |
| Immigrants | Congo | 1.2 /100 | #257 | Tragic 2.5% |
| Spanish | 1.1 /100 | #258 | Tragic 2.5% |
| Comanche | 1.0 /100 | #259 | Tragic 2.5% |
| Immigrants | Caribbean | 1.0 /100 | #260 | Tragic 2.5% |
| Immigrants | Belize | 0.9 /100 | #261 | Tragic 2.5% |
| Immigrants | Liberia | 0.8 /100 | #262 | Tragic 2.5% |
| Dominicans | 0.8 /100 | #263 | Tragic 2.5% |
| Indonesians | 0.5 /100 | #264 | Tragic 2.6% |
| Immigrants | Micronesia | 0.5 /100 | #265 | Tragic 2.6% |
| French American Indians | 0.5 /100 | #266 | Tragic 2.6% |
| Guamanians/Chamorros | 0.4 /100 | #267 | Tragic 2.6% |