Bahamian vs Immigrants from Norway Single Father Households
COMPARE
Bahamian
Immigrants from Norway
Single Father Households
Single Father Households Comparison
Bahamians
Immigrants from Norway
2.5%
SINGLE FATHER HOUSEHOLDS
2.4/ 100
METRIC RATING
248th/ 347
METRIC RANK
2.0%
SINGLE FATHER HOUSEHOLDS
99.9/ 100
METRIC RATING
56th/ 347
METRIC RANK
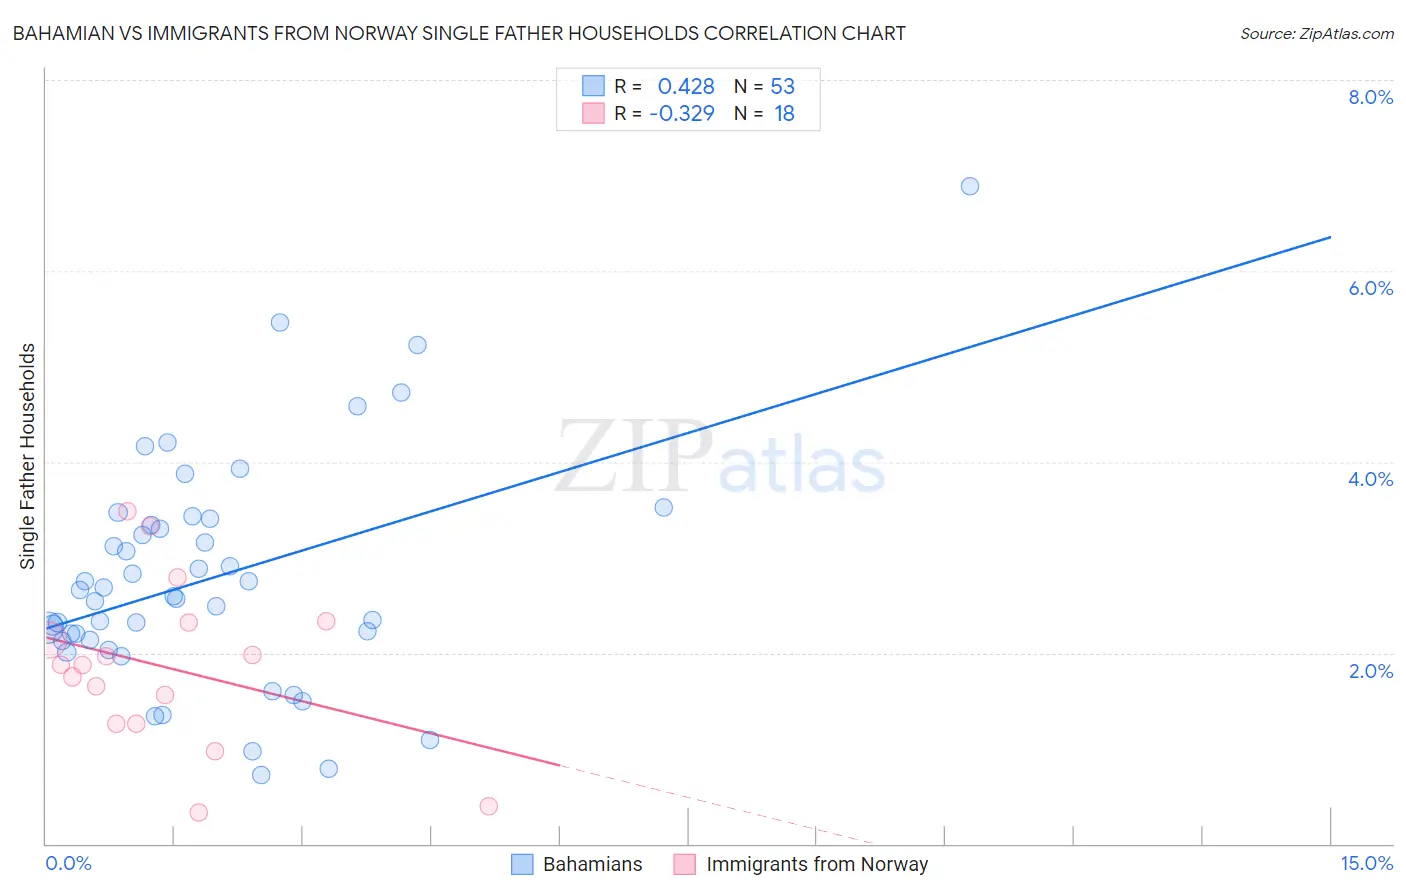
Bahamian vs Immigrants from Norway Single Father Households Correlation Chart
The statistical analysis conducted on geographies consisting of 112,214,100 people shows a moderate positive correlation between the proportion of Bahamians and percentage of single father households in the United States with a correlation coefficient (R) of 0.428 and weighted average of 2.5%. Similarly, the statistical analysis conducted on geographies consisting of 116,272,721 people shows a mild negative correlation between the proportion of Immigrants from Norway and percentage of single father households in the United States with a correlation coefficient (R) of -0.329 and weighted average of 2.0%, a difference of 23.1%.
Single Father Households Correlation Summary
| Measurement | Bahamian | Immigrants from Norway |
| Minimum | 0.72% | 0.32% |
| Maximum | 6.9% | 3.5% |
| Range | 6.2% | 3.2% |
| Mean | 2.8% | 1.8% |
| Median | 2.6% | 1.9% |
| Interquartile 25% (IQ1) | 2.1% | 1.3% |
| Interquartile 75% (IQ3) | 3.4% | 2.3% |
| Interquartile Range (IQR) | 1.2% | 1.1% |
| Standard Deviation (Sample) | 1.2% | 0.85% |
| Standard Deviation (Population) | 1.2% | 0.83% |
Similar Demographics by Single Father Households
Demographics Similar to Bahamians by Single Father Households
In terms of single father households, the demographic groups most similar to Bahamians are Delaware (2.5%, a difference of 0.040%), Native Hawaiian (2.5%, a difference of 0.060%), Basque (2.5%, a difference of 0.080%), Immigrants from Cameroon (2.5%, a difference of 0.090%), and Somali (2.5%, a difference of 0.25%).
| Demographics | Rating | Rank | Single Father Households |
| Portuguese | 4.1 /100 | #241 | Tragic 2.5% |
| Osage | 4.1 /100 | #242 | Tragic 2.5% |
| Spaniards | 3.1 /100 | #243 | Tragic 2.5% |
| Immigrants | Middle Africa | 2.8 /100 | #244 | Tragic 2.5% |
| Basques | 2.5 /100 | #245 | Tragic 2.5% |
| Native Hawaiians | 2.5 /100 | #246 | Tragic 2.5% |
| Delaware | 2.5 /100 | #247 | Tragic 2.5% |
| Bahamians | 2.4 /100 | #248 | Tragic 2.5% |
| Immigrants | Cameroon | 2.3 /100 | #249 | Tragic 2.5% |
| Somalis | 2.1 /100 | #250 | Tragic 2.5% |
| Liberians | 2.0 /100 | #251 | Tragic 2.5% |
| Immigrants | Eritrea | 2.0 /100 | #252 | Tragic 2.5% |
| Immigrants | Somalia | 1.9 /100 | #253 | Tragic 2.5% |
| Immigrants | Thailand | 1.8 /100 | #254 | Tragic 2.5% |
| Tongans | 1.5 /100 | #255 | Tragic 2.5% |
Demographics Similar to Immigrants from Norway by Single Father Households
In terms of single father households, the demographic groups most similar to Immigrants from Norway are Immigrants from France (2.0%, a difference of 0.020%), Immigrants from Korea (2.0%, a difference of 0.080%), Immigrants from Northern Europe (2.0%, a difference of 0.22%), Burmese (2.0%, a difference of 0.26%), and Immigrants from Czechoslovakia (2.0%, a difference of 0.29%).
| Demographics | Rating | Rank | Single Father Households |
| Immigrants | Serbia | 99.9 /100 | #49 | Exceptional 2.0% |
| Immigrants | Switzerland | 99.9 /100 | #50 | Exceptional 2.0% |
| Immigrants | Poland | 99.9 /100 | #51 | Exceptional 2.0% |
| Immigrants | Europe | 99.9 /100 | #52 | Exceptional 2.0% |
| Immigrants | Northern Europe | 99.9 /100 | #53 | Exceptional 2.0% |
| Immigrants | Korea | 99.9 /100 | #54 | Exceptional 2.0% |
| Immigrants | France | 99.9 /100 | #55 | Exceptional 2.0% |
| Immigrants | Norway | 99.9 /100 | #56 | Exceptional 2.0% |
| Burmese | 99.9 /100 | #57 | Exceptional 2.0% |
| Immigrants | Czechoslovakia | 99.9 /100 | #58 | Exceptional 2.0% |
| Immigrants | North Macedonia | 99.9 /100 | #59 | Exceptional 2.0% |
| Immigrants | Austria | 99.9 /100 | #60 | Exceptional 2.0% |
| Vietnamese | 99.9 /100 | #61 | Exceptional 2.0% |
| Immigrants | Malaysia | 99.9 /100 | #62 | Exceptional 2.0% |
| Maltese | 99.9 /100 | #63 | Exceptional 2.0% |