Guamanian/Chamorro vs Immigrants from Poland Family Households
COMPARE
Guamanian/Chamorro
Immigrants from Poland
Family Households
Family Households Comparison
Guamanians/Chamorros
Immigrants from Poland
66.6%
FAMILY HOUSEHOLDS
100.0/ 100
METRIC RATING
40th/ 347
METRIC RANK
65.2%
FAMILY HOUSEHOLDS
98.7/ 100
METRIC RATING
94th/ 347
METRIC RANK
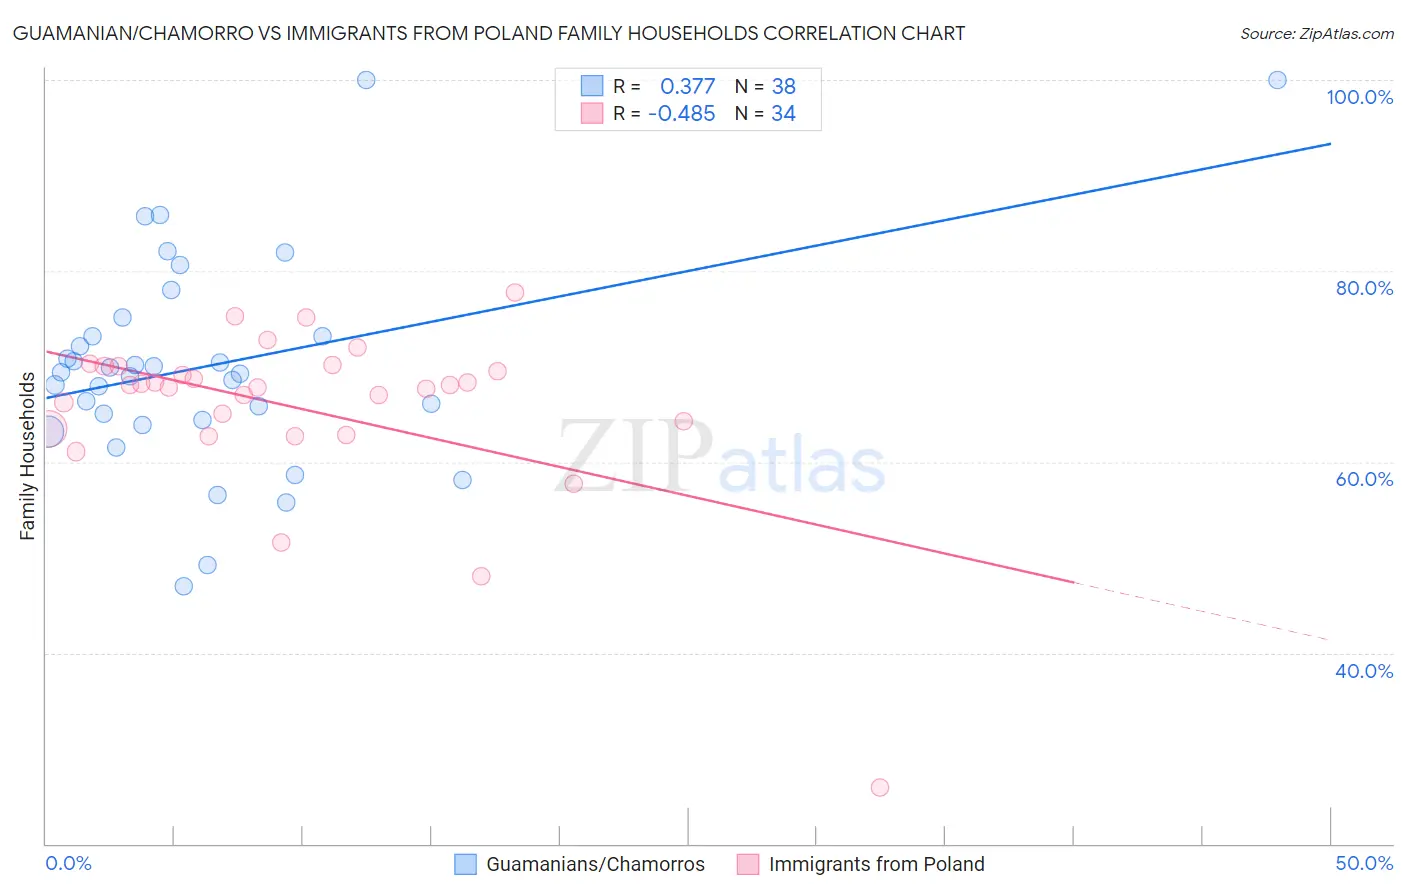
Guamanian/Chamorro vs Immigrants from Poland Family Households Correlation Chart
The statistical analysis conducted on geographies consisting of 221,865,945 people shows a mild positive correlation between the proportion of Guamanians/Chamorros and percentage of family households in the United States with a correlation coefficient (R) of 0.377 and weighted average of 66.6%. Similarly, the statistical analysis conducted on geographies consisting of 304,786,496 people shows a moderate negative correlation between the proportion of Immigrants from Poland and percentage of family households in the United States with a correlation coefficient (R) of -0.485 and weighted average of 65.2%, a difference of 2.1%.
Family Households Correlation Summary
| Measurement | Guamanian/Chamorro | Immigrants from Poland |
| Minimum | 47.0% | 25.9% |
| Maximum | 100.0% | 77.7% |
| Range | 53.0% | 51.8% |
| Mean | 70.1% | 65.6% |
| Median | 69.3% | 67.9% |
| Interquartile 25% (IQ1) | 64.4% | 63.4% |
| Interquartile 75% (IQ3) | 73.2% | 70.0% |
| Interquartile Range (IQR) | 8.8% | 6.6% |
| Standard Deviation (Sample) | 11.3% | 9.2% |
| Standard Deviation (Population) | 11.1% | 9.0% |
Similar Demographics by Family Households
Demographics Similar to Guamanians/Chamorros by Family Households
In terms of family households, the demographic groups most similar to Guamanians/Chamorros are Immigrants from Bolivia (66.6%, a difference of 0.030%), Menominee (66.5%, a difference of 0.090%), Apache (66.5%, a difference of 0.10%), Asian (66.5%, a difference of 0.15%), and Venezuelan (66.5%, a difference of 0.17%).
| Demographics | Rating | Rank | Family Households |
| Salvadorans | 100.0 /100 | #33 | Exceptional 67.2% |
| Thais | 100.0 /100 | #34 | Exceptional 67.2% |
| Tohono O'odham | 100.0 /100 | #35 | Exceptional 67.1% |
| Peruvians | 100.0 /100 | #36 | Exceptional 67.1% |
| Tsimshian | 100.0 /100 | #37 | Exceptional 67.1% |
| Mexican American Indians | 100.0 /100 | #38 | Exceptional 67.0% |
| Immigrants | El Salvador | 100.0 /100 | #39 | Exceptional 67.0% |
| Guamanians/Chamorros | 100.0 /100 | #40 | Exceptional 66.6% |
| Immigrants | Bolivia | 100.0 /100 | #41 | Exceptional 66.6% |
| Menominee | 100.0 /100 | #42 | Exceptional 66.5% |
| Apache | 100.0 /100 | #43 | Exceptional 66.5% |
| Asians | 100.0 /100 | #44 | Exceptional 66.5% |
| Venezuelans | 100.0 /100 | #45 | Exceptional 66.5% |
| Arapaho | 100.0 /100 | #46 | Exceptional 66.5% |
| Bolivians | 100.0 /100 | #47 | Exceptional 66.5% |
Demographics Similar to Immigrants from Poland by Family Households
In terms of family households, the demographic groups most similar to Immigrants from Poland are Hopi (65.3%, a difference of 0.020%), Guyanese (65.3%, a difference of 0.020%), Immigrants from Portugal (65.2%, a difference of 0.030%), Swiss (65.2%, a difference of 0.030%), and Guatemalan (65.2%, a difference of 0.030%).
| Demographics | Rating | Rank | Family Households |
| Immigrants | Egypt | 99.2 /100 | #87 | Exceptional 65.3% |
| Immigrants | Haiti | 99.1 /100 | #88 | Exceptional 65.3% |
| Immigrants | Caribbean | 99.1 /100 | #89 | Exceptional 65.3% |
| Immigrants | Laos | 99.1 /100 | #90 | Exceptional 65.3% |
| Crow | 98.9 /100 | #91 | Exceptional 65.3% |
| Hopi | 98.8 /100 | #92 | Exceptional 65.3% |
| Guyanese | 98.8 /100 | #93 | Exceptional 65.3% |
| Immigrants | Poland | 98.7 /100 | #94 | Exceptional 65.2% |
| Immigrants | Portugal | 98.6 /100 | #95 | Exceptional 65.2% |
| Swiss | 98.6 /100 | #96 | Exceptional 65.2% |
| Guatemalans | 98.6 /100 | #97 | Exceptional 65.2% |
| Immigrants | Syria | 98.4 /100 | #98 | Exceptional 65.2% |
| Central American Indians | 98.3 /100 | #99 | Exceptional 65.2% |
| Haitians | 98.1 /100 | #100 | Exceptional 65.2% |
| Chileans | 98.1 /100 | #101 | Exceptional 65.2% |