Guamanian/Chamorro vs Immigrants from Cabo Verde Doctorate Degree
COMPARE
Guamanian/Chamorro
Immigrants from Cabo Verde
Doctorate Degree
Doctorate Degree Comparison
Guamanians/Chamorros
Immigrants from Cabo Verde
1.6%
DOCTORATE DEGREE
3.3/ 100
METRIC RATING
232nd/ 347
METRIC RANK
1.3%
DOCTORATE DEGREE
0.0/ 100
METRIC RATING
326th/ 347
METRIC RANK
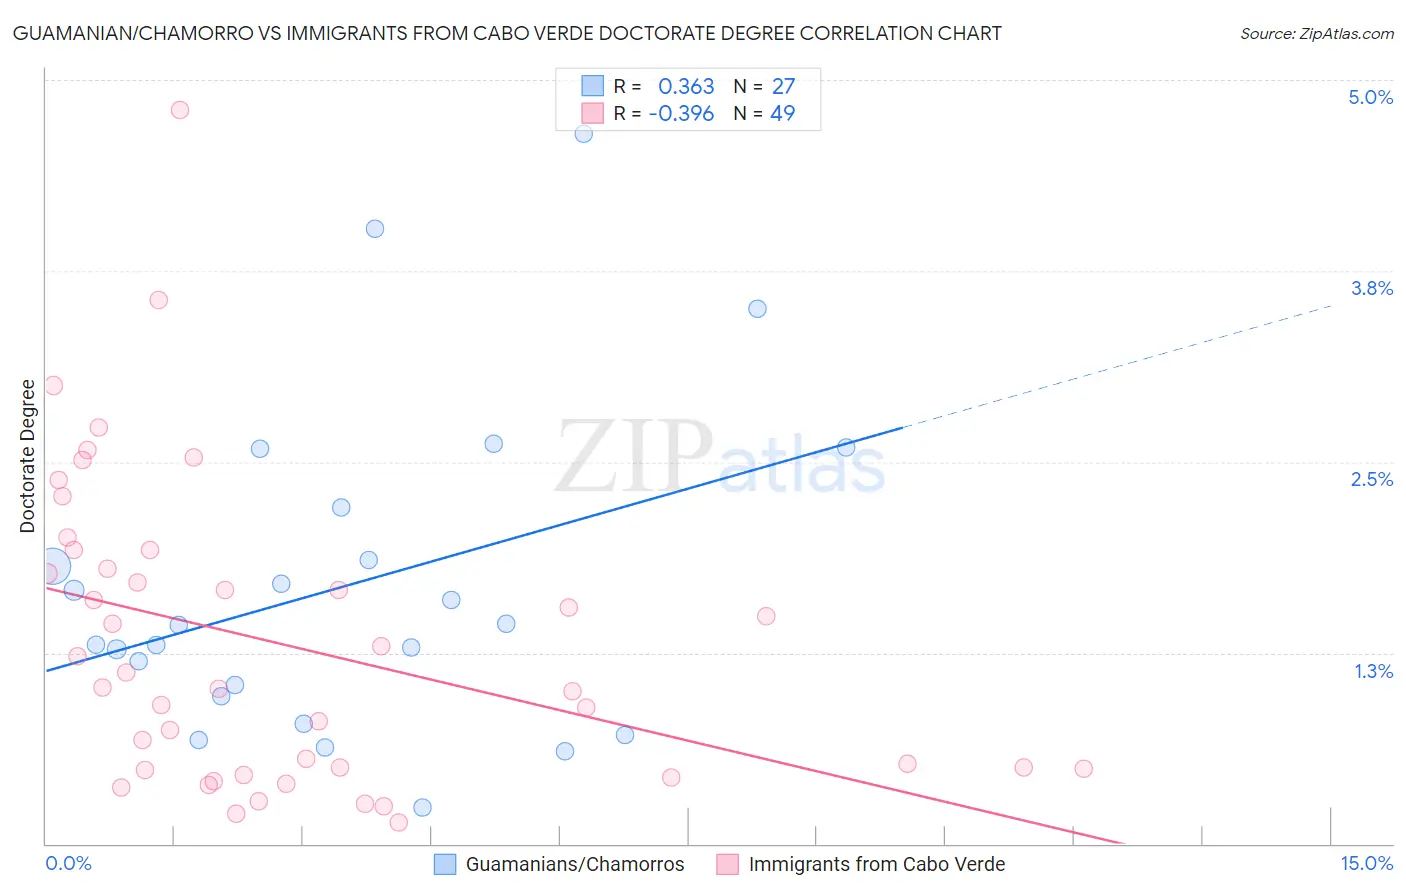
Guamanian/Chamorro vs Immigrants from Cabo Verde Doctorate Degree Correlation Chart
The statistical analysis conducted on geographies consisting of 220,575,272 people shows a mild positive correlation between the proportion of Guamanians/Chamorros and percentage of population with at least doctorate degree education in the United States with a correlation coefficient (R) of 0.363 and weighted average of 1.6%. Similarly, the statistical analysis conducted on geographies consisting of 38,072,290 people shows a mild negative correlation between the proportion of Immigrants from Cabo Verde and percentage of population with at least doctorate degree education in the United States with a correlation coefficient (R) of -0.396 and weighted average of 1.3%, a difference of 22.2%.
Doctorate Degree Correlation Summary
| Measurement | Guamanian/Chamorro | Immigrants from Cabo Verde |
| Minimum | 0.23% | 0.14% |
| Maximum | 4.6% | 4.8% |
| Range | 4.4% | 4.7% |
| Mean | 1.7% | 1.3% |
| Median | 1.4% | 1.0% |
| Interquartile 25% (IQ1) | 0.97% | 0.49% |
| Interquartile 75% (IQ3) | 2.2% | 1.9% |
| Interquartile Range (IQR) | 1.2% | 1.4% |
| Standard Deviation (Sample) | 1.1% | 0.99% |
| Standard Deviation (Population) | 1.0% | 0.98% |
Similar Demographics by Doctorate Degree
Demographics Similar to Guamanians/Chamorros by Doctorate Degree
In terms of doctorate degree, the demographic groups most similar to Guamanians/Chamorros are Barbadian (1.6%, a difference of 0.070%), Hopi (1.6%, a difference of 0.21%), Cree (1.6%, a difference of 0.43%), Immigrants from North Macedonia (1.6%, a difference of 0.69%), and Indonesian (1.6%, a difference of 0.71%).
| Demographics | Rating | Rank | Doctorate Degree |
| Immigrants | Colombia | 6.7 /100 | #225 | Tragic 1.7% |
| Osage | 6.5 /100 | #226 | Tragic 1.7% |
| Panamanians | 6.3 /100 | #227 | Tragic 1.7% |
| Assyrians/Chaldeans/Syriacs | 5.9 /100 | #228 | Tragic 1.7% |
| Colville | 4.7 /100 | #229 | Tragic 1.6% |
| Immigrants | Philippines | 4.3 /100 | #230 | Tragic 1.6% |
| Immigrants | North Macedonia | 3.9 /100 | #231 | Tragic 1.6% |
| Guamanians/Chamorros | 3.3 /100 | #232 | Tragic 1.6% |
| Barbadians | 3.3 /100 | #233 | Tragic 1.6% |
| Hopi | 3.2 /100 | #234 | Tragic 1.6% |
| Cree | 3.0 /100 | #235 | Tragic 1.6% |
| Indonesians | 2.8 /100 | #236 | Tragic 1.6% |
| Iroquois | 2.7 /100 | #237 | Tragic 1.6% |
| Immigrants | Congo | 2.6 /100 | #238 | Tragic 1.6% |
| West Indians | 2.5 /100 | #239 | Tragic 1.6% |
Demographics Similar to Immigrants from Cabo Verde by Doctorate Degree
In terms of doctorate degree, the demographic groups most similar to Immigrants from Cabo Verde are Pima (1.3%, a difference of 0.020%), Hispanic or Latino (1.3%, a difference of 0.29%), Native/Alaskan (1.3%, a difference of 0.41%), Immigrants from Belize (1.3%, a difference of 0.74%), and Inupiat (1.3%, a difference of 0.87%).
| Demographics | Rating | Rank | Doctorate Degree |
| Immigrants | Guyana | 0.1 /100 | #319 | Tragic 1.3% |
| Immigrants | St. Vincent and the Grenadines | 0.1 /100 | #320 | Tragic 1.3% |
| Dutch West Indians | 0.1 /100 | #321 | Tragic 1.3% |
| Seminole | 0.1 /100 | #322 | Tragic 1.3% |
| Immigrants | Belize | 0.1 /100 | #323 | Tragic 1.3% |
| Natives/Alaskans | 0.0 /100 | #324 | Tragic 1.3% |
| Pima | 0.0 /100 | #325 | Tragic 1.3% |
| Immigrants | Cabo Verde | 0.0 /100 | #326 | Tragic 1.3% |
| Hispanics or Latinos | 0.0 /100 | #327 | Tragic 1.3% |
| Inupiat | 0.0 /100 | #328 | Tragic 1.3% |
| Haitians | 0.0 /100 | #329 | Tragic 1.3% |
| Yup'ik | 0.0 /100 | #330 | Tragic 1.3% |
| Immigrants | Latin America | 0.0 /100 | #331 | Tragic 1.3% |
| Yakama | 0.0 /100 | #332 | Tragic 1.3% |
| Immigrants | Caribbean | 0.0 /100 | #333 | Tragic 1.3% |