German vs Mexican Married-couple Households
COMPARE
German
Mexican
Married-couple Households
Married-couple Households Comparison
Germans
Mexicans
49.2%
MARRIED-COUPLE HOUSEHOLDS
99.8/ 100
METRIC RATING
28th/ 347
METRIC RANK
47.1%
MARRIED-COUPLE HOUSEHOLDS
83.4/ 100
METRIC RATING
144th/ 347
METRIC RANK
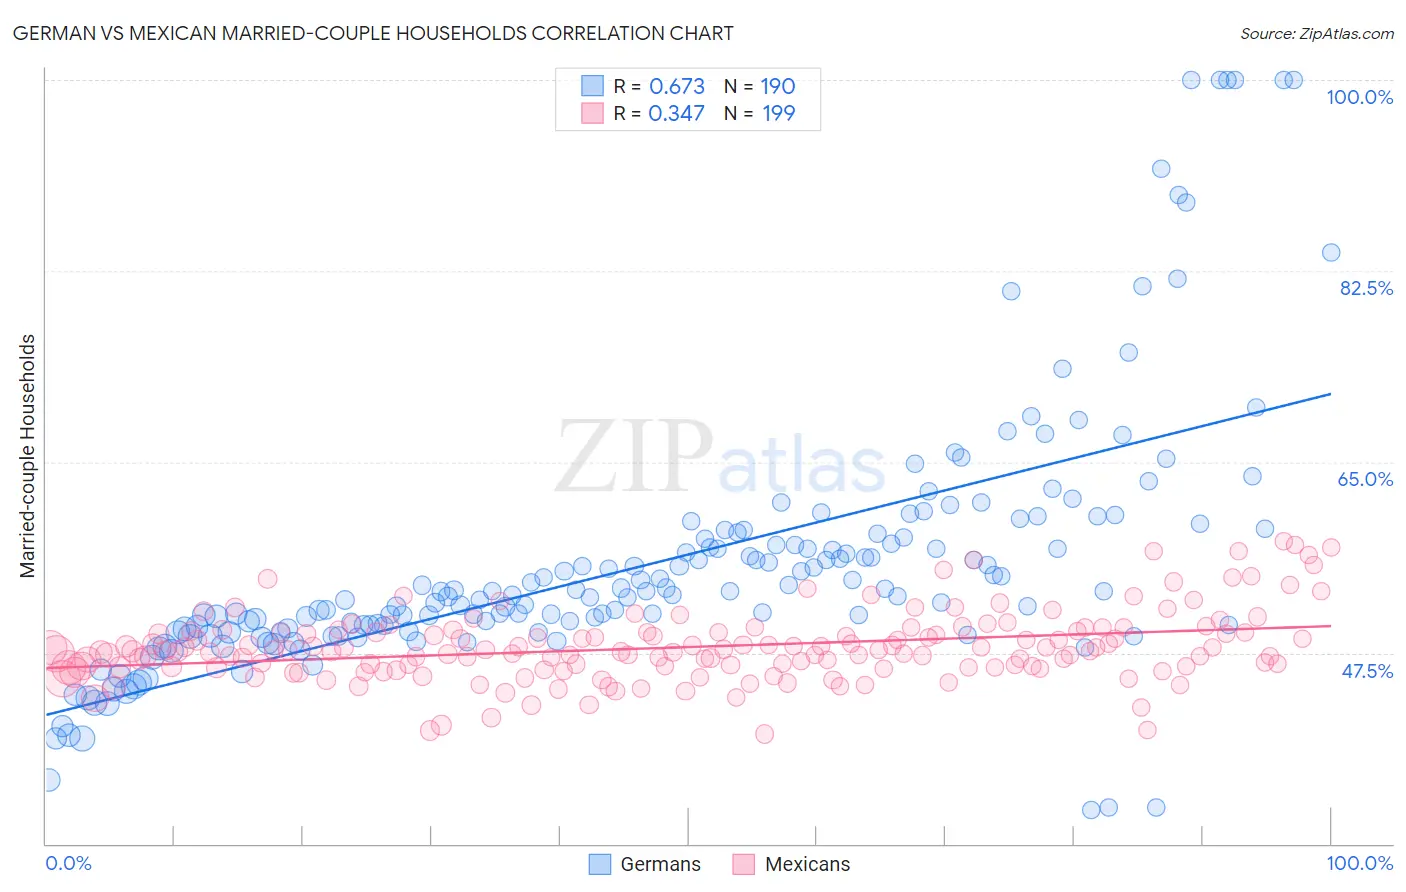
German vs Mexican Married-couple Households Correlation Chart
The statistical analysis conducted on geographies consisting of 580,558,752 people shows a significant positive correlation between the proportion of Germans and percentage of married-couple family households in the United States with a correlation coefficient (R) of 0.673 and weighted average of 49.2%. Similarly, the statistical analysis conducted on geographies consisting of 560,704,291 people shows a mild positive correlation between the proportion of Mexicans and percentage of married-couple family households in the United States with a correlation coefficient (R) of 0.347 and weighted average of 47.1%, a difference of 4.3%.
Married-couple Households Correlation Summary
| Measurement | German | Mexican |
| Minimum | 33.1% | 40.1% |
| Maximum | 100.0% | 57.7% |
| Range | 66.9% | 17.6% |
| Mean | 55.8% | 48.0% |
| Median | 53.1% | 47.6% |
| Interquartile 25% (IQ1) | 49.7% | 46.2% |
| Interquartile 75% (IQ3) | 58.1% | 49.4% |
| Interquartile Range (IQR) | 8.4% | 3.2% |
| Standard Deviation (Sample) | 12.1% | 3.2% |
| Standard Deviation (Population) | 12.1% | 3.2% |
Similar Demographics by Married-couple Households
Demographics Similar to Germans by Married-couple Households
In terms of married-couple households, the demographic groups most similar to Germans are Maltese (49.2%, a difference of 0.010%), Bolivian (49.2%, a difference of 0.020%), Native Hawaiian (49.1%, a difference of 0.13%), Bhutanese (49.3%, a difference of 0.19%), and Hungarian (49.1%, a difference of 0.19%).
| Demographics | Rating | Rank | Married-couple Households |
| Norwegians | 99.9 /100 | #21 | Exceptional 49.5% |
| Asians | 99.9 /100 | #22 | Exceptional 49.5% |
| Dutch | 99.9 /100 | #23 | Exceptional 49.5% |
| Czechs | 99.9 /100 | #24 | Exceptional 49.4% |
| Immigrants | Philippines | 99.9 /100 | #25 | Exceptional 49.3% |
| Immigrants | Scotland | 99.8 /100 | #26 | Exceptional 49.3% |
| Bhutanese | 99.8 /100 | #27 | Exceptional 49.3% |
| Germans | 99.8 /100 | #28 | Exceptional 49.2% |
| Maltese | 99.8 /100 | #29 | Exceptional 49.2% |
| Bolivians | 99.8 /100 | #30 | Exceptional 49.2% |
| Native Hawaiians | 99.8 /100 | #31 | Exceptional 49.1% |
| Hungarians | 99.8 /100 | #32 | Exceptional 49.1% |
| Immigrants | Asia | 99.7 /100 | #33 | Exceptional 49.1% |
| Italians | 99.7 /100 | #34 | Exceptional 49.0% |
| Scottish | 99.7 /100 | #35 | Exceptional 49.0% |
Demographics Similar to Mexicans by Married-couple Households
In terms of married-couple households, the demographic groups most similar to Mexicans are Immigrants from Belarus (47.2%, a difference of 0.020%), Spaniard (47.2%, a difference of 0.050%), Spanish (47.2%, a difference of 0.070%), Costa Rican (47.2%, a difference of 0.070%), and Immigrants from Sweden (47.2%, a difference of 0.090%).
| Demographics | Rating | Rank | Married-couple Households |
| Immigrants | Malaysia | 85.2 /100 | #137 | Excellent 47.2% |
| Immigrants | Afghanistan | 85.1 /100 | #138 | Excellent 47.2% |
| Immigrants | Sweden | 84.7 /100 | #139 | Excellent 47.2% |
| Spanish | 84.5 /100 | #140 | Excellent 47.2% |
| Costa Ricans | 84.4 /100 | #141 | Excellent 47.2% |
| Spaniards | 84.1 /100 | #142 | Excellent 47.2% |
| Immigrants | Belarus | 83.8 /100 | #143 | Excellent 47.2% |
| Mexicans | 83.4 /100 | #144 | Excellent 47.1% |
| Slovenes | 81.7 /100 | #145 | Excellent 47.1% |
| Immigrants | Western Europe | 81.6 /100 | #146 | Excellent 47.1% |
| Immigrants | Syria | 81.6 /100 | #147 | Excellent 47.1% |
| Icelanders | 79.5 /100 | #148 | Good 47.0% |
| Paraguayans | 78.7 /100 | #149 | Good 47.0% |
| Immigrants | Russia | 77.6 /100 | #150 | Good 47.0% |
| Immigrants | Bulgaria | 76.8 /100 | #151 | Good 47.0% |