Immigrants from Sweden vs Mexican Married-couple Households
COMPARE
Immigrants from Sweden
Mexican
Married-couple Households
Married-couple Households Comparison
Immigrants from Sweden
Mexicans
47.2%
MARRIED-COUPLE HOUSEHOLDS
84.7/ 100
METRIC RATING
139th/ 347
METRIC RANK
47.1%
MARRIED-COUPLE HOUSEHOLDS
83.4/ 100
METRIC RATING
144th/ 347
METRIC RANK
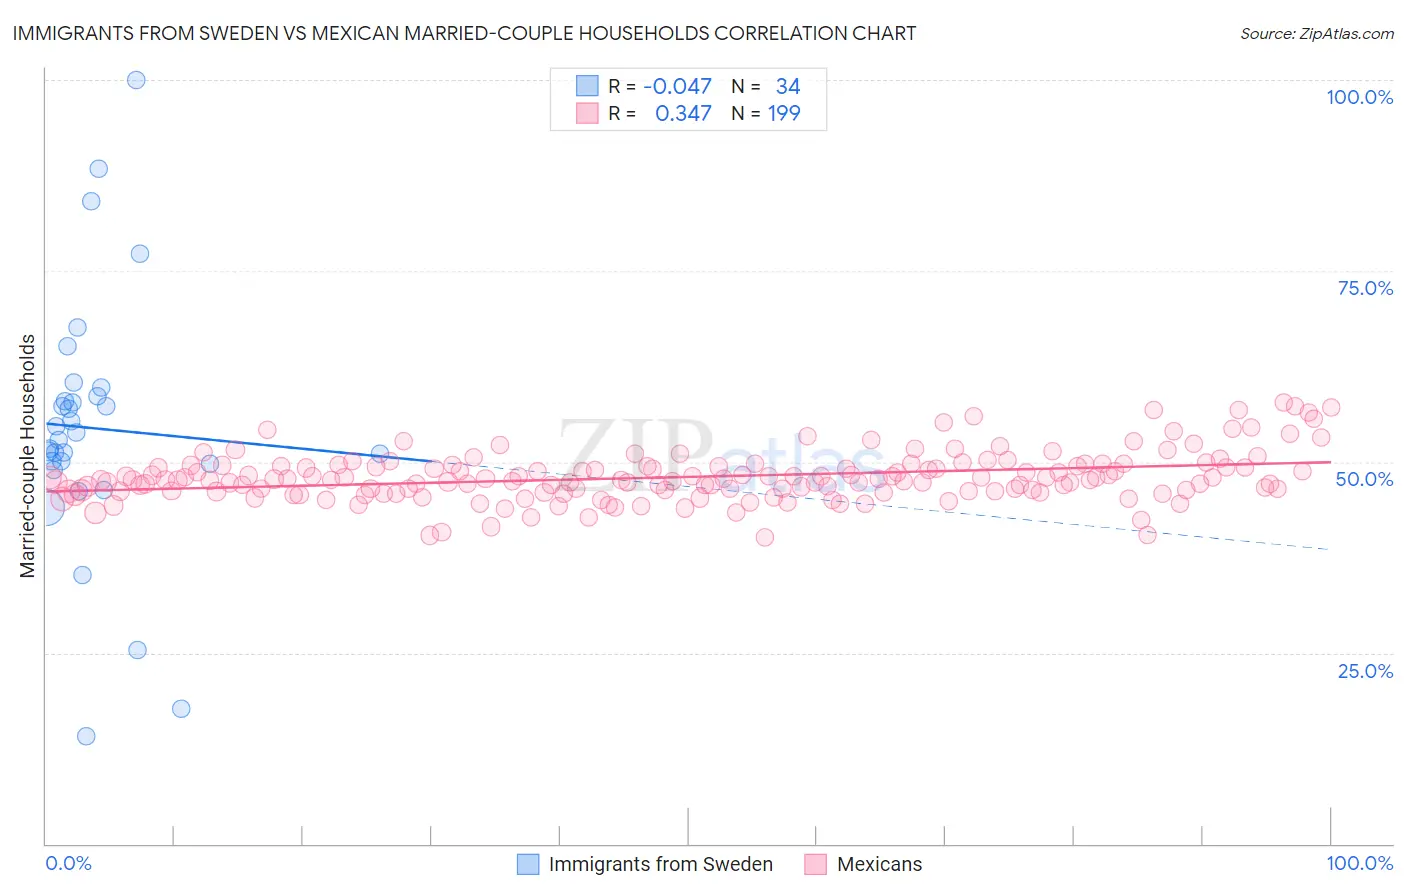
Immigrants from Sweden vs Mexican Married-couple Households Correlation Chart
The statistical analysis conducted on geographies consisting of 164,705,416 people shows no correlation between the proportion of Immigrants from Sweden and percentage of married-couple family households in the United States with a correlation coefficient (R) of -0.047 and weighted average of 47.2%. Similarly, the statistical analysis conducted on geographies consisting of 560,704,291 people shows a mild positive correlation between the proportion of Mexicans and percentage of married-couple family households in the United States with a correlation coefficient (R) of 0.347 and weighted average of 47.1%, a difference of 0.090%.
Married-couple Households Correlation Summary
| Measurement | Immigrants from Sweden | Mexican |
| Minimum | 14.1% | 40.1% |
| Maximum | 100.0% | 57.7% |
| Range | 85.9% | 17.6% |
| Mean | 54.4% | 48.0% |
| Median | 53.4% | 47.6% |
| Interquartile 25% (IQ1) | 49.7% | 46.2% |
| Interquartile 75% (IQ3) | 58.6% | 49.4% |
| Interquartile Range (IQR) | 8.9% | 3.2% |
| Standard Deviation (Sample) | 17.1% | 3.2% |
| Standard Deviation (Population) | 16.8% | 3.2% |
Demographics Similar to Immigrants from Sweden and Mexicans by Married-couple Households
In terms of married-couple households, the demographic groups most similar to Immigrants from Sweden are Spanish (47.2%, a difference of 0.020%), Costa Rican (47.2%, a difference of 0.020%), Immigrants from Afghanistan (47.2%, a difference of 0.030%), New Zealander (47.2%, a difference of 0.040%), and Immigrants from Malaysia (47.2%, a difference of 0.040%). Similarly, the demographic groups most similar to Mexicans are Immigrants from Belarus (47.2%, a difference of 0.020%), Spaniard (47.2%, a difference of 0.050%), Spanish (47.2%, a difference of 0.070%), Costa Rican (47.2%, a difference of 0.070%), and Slovene (47.1%, a difference of 0.11%).
| Demographics | Rating | Rank | Married-couple Households |
| Immigrants | Denmark | 87.5 /100 | #131 | Excellent 47.3% |
| Immigrants | Ukraine | 86.7 /100 | #132 | Excellent 47.3% |
| South Africans | 86.4 /100 | #133 | Excellent 47.3% |
| Immigrants | Greece | 86.0 /100 | #134 | Excellent 47.2% |
| Immigrants | Argentina | 86.0 /100 | #135 | Excellent 47.2% |
| New Zealanders | 85.3 /100 | #136 | Excellent 47.2% |
| Immigrants | Malaysia | 85.2 /100 | #137 | Excellent 47.2% |
| Immigrants | Afghanistan | 85.1 /100 | #138 | Excellent 47.2% |
| Immigrants | Sweden | 84.7 /100 | #139 | Excellent 47.2% |
| Spanish | 84.5 /100 | #140 | Excellent 47.2% |
| Costa Ricans | 84.4 /100 | #141 | Excellent 47.2% |
| Spaniards | 84.1 /100 | #142 | Excellent 47.2% |
| Immigrants | Belarus | 83.8 /100 | #143 | Excellent 47.2% |
| Mexicans | 83.4 /100 | #144 | Excellent 47.1% |
| Slovenes | 81.7 /100 | #145 | Excellent 47.1% |
| Immigrants | Western Europe | 81.6 /100 | #146 | Excellent 47.1% |
| Immigrants | Syria | 81.6 /100 | #147 | Excellent 47.1% |
| Icelanders | 79.5 /100 | #148 | Good 47.0% |
| Paraguayans | 78.7 /100 | #149 | Good 47.0% |
| Immigrants | Russia | 77.6 /100 | #150 | Good 47.0% |
| Immigrants | Bulgaria | 76.8 /100 | #151 | Good 47.0% |