German vs Immigrants from Bangladesh Married-couple Households
COMPARE
German
Immigrants from Bangladesh
Married-couple Households
Married-couple Households Comparison
Germans
Immigrants from Bangladesh
49.2%
MARRIED-COUPLE HOUSEHOLDS
99.8/ 100
METRIC RATING
28th/ 347
METRIC RANK
43.1%
MARRIED-COUPLE HOUSEHOLDS
0.0/ 100
METRIC RATING
275th/ 347
METRIC RANK
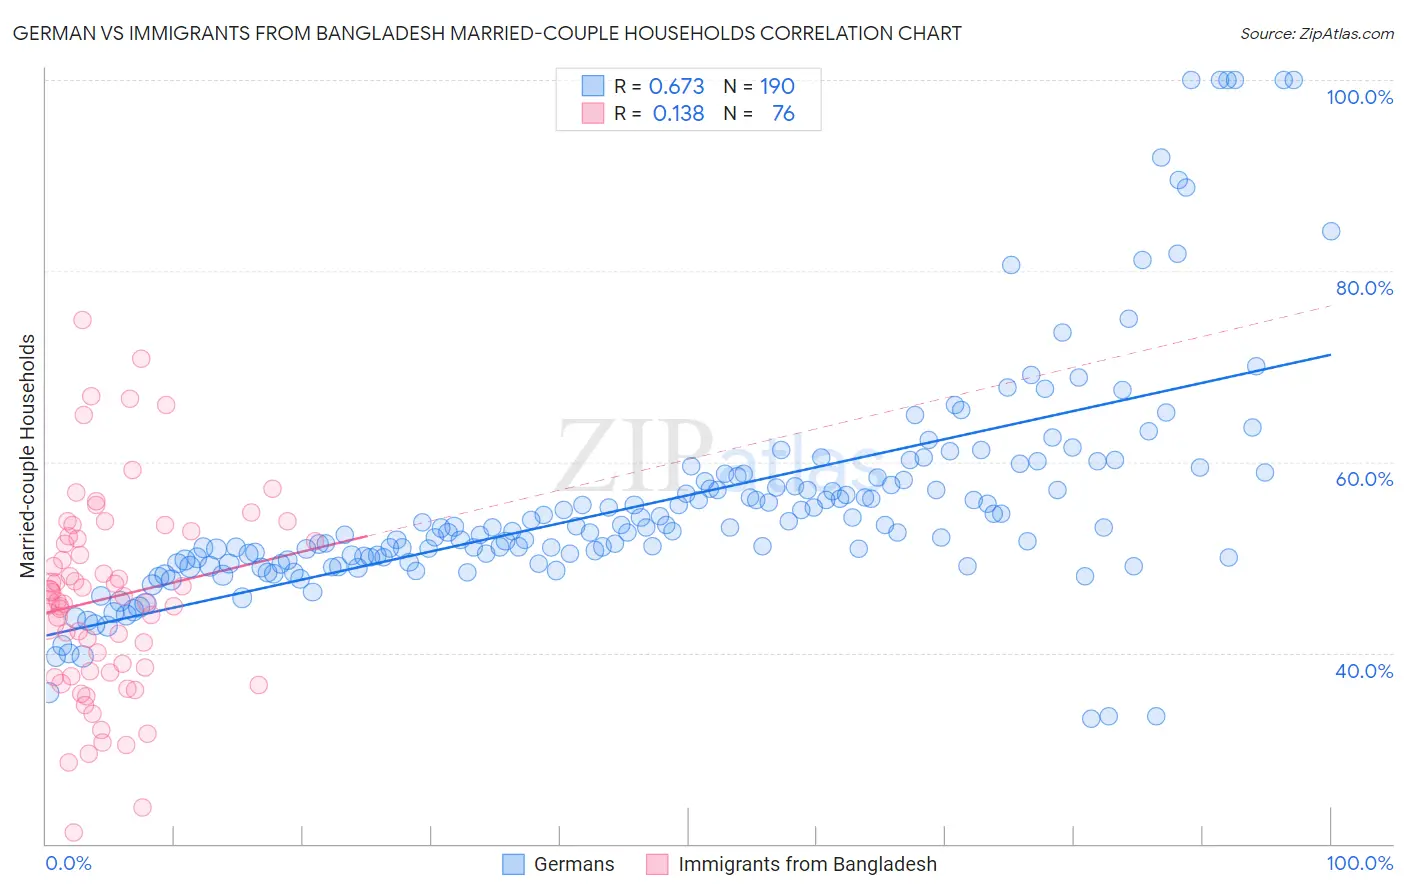
German vs Immigrants from Bangladesh Married-couple Households Correlation Chart
The statistical analysis conducted on geographies consisting of 580,558,752 people shows a significant positive correlation between the proportion of Germans and percentage of married-couple family households in the United States with a correlation coefficient (R) of 0.673 and weighted average of 49.2%. Similarly, the statistical analysis conducted on geographies consisting of 203,568,346 people shows a poor positive correlation between the proportion of Immigrants from Bangladesh and percentage of married-couple family households in the United States with a correlation coefficient (R) of 0.138 and weighted average of 43.1%, a difference of 14.1%.
Married-couple Households Correlation Summary
| Measurement | German | Immigrants from Bangladesh |
| Minimum | 33.1% | 21.2% |
| Maximum | 100.0% | 74.9% |
| Range | 66.9% | 53.7% |
| Mean | 55.8% | 45.7% |
| Median | 53.1% | 45.7% |
| Interquartile 25% (IQ1) | 49.7% | 38.0% |
| Interquartile 75% (IQ3) | 58.1% | 52.1% |
| Interquartile Range (IQR) | 8.4% | 14.1% |
| Standard Deviation (Sample) | 12.1% | 10.5% |
| Standard Deviation (Population) | 12.1% | 10.4% |
Similar Demographics by Married-couple Households
Demographics Similar to Germans by Married-couple Households
In terms of married-couple households, the demographic groups most similar to Germans are Maltese (49.2%, a difference of 0.010%), Bolivian (49.2%, a difference of 0.020%), Native Hawaiian (49.1%, a difference of 0.13%), Bhutanese (49.3%, a difference of 0.19%), and Hungarian (49.1%, a difference of 0.19%).
| Demographics | Rating | Rank | Married-couple Households |
| Norwegians | 99.9 /100 | #21 | Exceptional 49.5% |
| Asians | 99.9 /100 | #22 | Exceptional 49.5% |
| Dutch | 99.9 /100 | #23 | Exceptional 49.5% |
| Czechs | 99.9 /100 | #24 | Exceptional 49.4% |
| Immigrants | Philippines | 99.9 /100 | #25 | Exceptional 49.3% |
| Immigrants | Scotland | 99.8 /100 | #26 | Exceptional 49.3% |
| Bhutanese | 99.8 /100 | #27 | Exceptional 49.3% |
| Germans | 99.8 /100 | #28 | Exceptional 49.2% |
| Maltese | 99.8 /100 | #29 | Exceptional 49.2% |
| Bolivians | 99.8 /100 | #30 | Exceptional 49.2% |
| Native Hawaiians | 99.8 /100 | #31 | Exceptional 49.1% |
| Hungarians | 99.8 /100 | #32 | Exceptional 49.1% |
| Immigrants | Asia | 99.7 /100 | #33 | Exceptional 49.1% |
| Italians | 99.7 /100 | #34 | Exceptional 49.0% |
| Scottish | 99.7 /100 | #35 | Exceptional 49.0% |
Demographics Similar to Immigrants from Bangladesh by Married-couple Households
In terms of married-couple households, the demographic groups most similar to Immigrants from Bangladesh are Immigrants from Ethiopia (43.1%, a difference of 0.11%), Nigerian (43.2%, a difference of 0.14%), Ethiopian (43.2%, a difference of 0.15%), Immigrants from Nigeria (43.2%, a difference of 0.25%), and Guatemalan (43.3%, a difference of 0.35%).
| Demographics | Rating | Rank | Married-couple Households |
| Immigrants | Burma/Myanmar | 0.1 /100 | #268 | Tragic 43.4% |
| Immigrants | Sierra Leone | 0.1 /100 | #269 | Tragic 43.3% |
| Yuman | 0.1 /100 | #270 | Tragic 43.3% |
| Guatemalans | 0.1 /100 | #271 | Tragic 43.3% |
| Immigrants | Nigeria | 0.1 /100 | #272 | Tragic 43.2% |
| Ethiopians | 0.1 /100 | #273 | Tragic 43.2% |
| Nigerians | 0.1 /100 | #274 | Tragic 43.2% |
| Immigrants | Bangladesh | 0.0 /100 | #275 | Tragic 43.1% |
| Immigrants | Ethiopia | 0.0 /100 | #276 | Tragic 43.1% |
| Immigrants | Eastern Africa | 0.0 /100 | #277 | Tragic 42.9% |
| Immigrants | Africa | 0.0 /100 | #278 | Tragic 42.9% |
| Sierra Leoneans | 0.0 /100 | #279 | Tragic 42.9% |
| Immigrants | Ecuador | 0.0 /100 | #280 | Tragic 42.9% |
| Immigrants | Guatemala | 0.0 /100 | #281 | Tragic 42.8% |
| Bermudans | 0.0 /100 | #282 | Tragic 42.4% |