German vs Mexican Male Unemployment
COMPARE
German
Mexican
Male Unemployment
Male Unemployment Comparison
Germans
Mexicans
4.7%
MALE UNEMPLOYMENT
100.0/ 100
METRIC RATING
14th/ 347
METRIC RANK
5.8%
MALE UNEMPLOYMENT
0.2/ 100
METRIC RATING
252nd/ 347
METRIC RANK
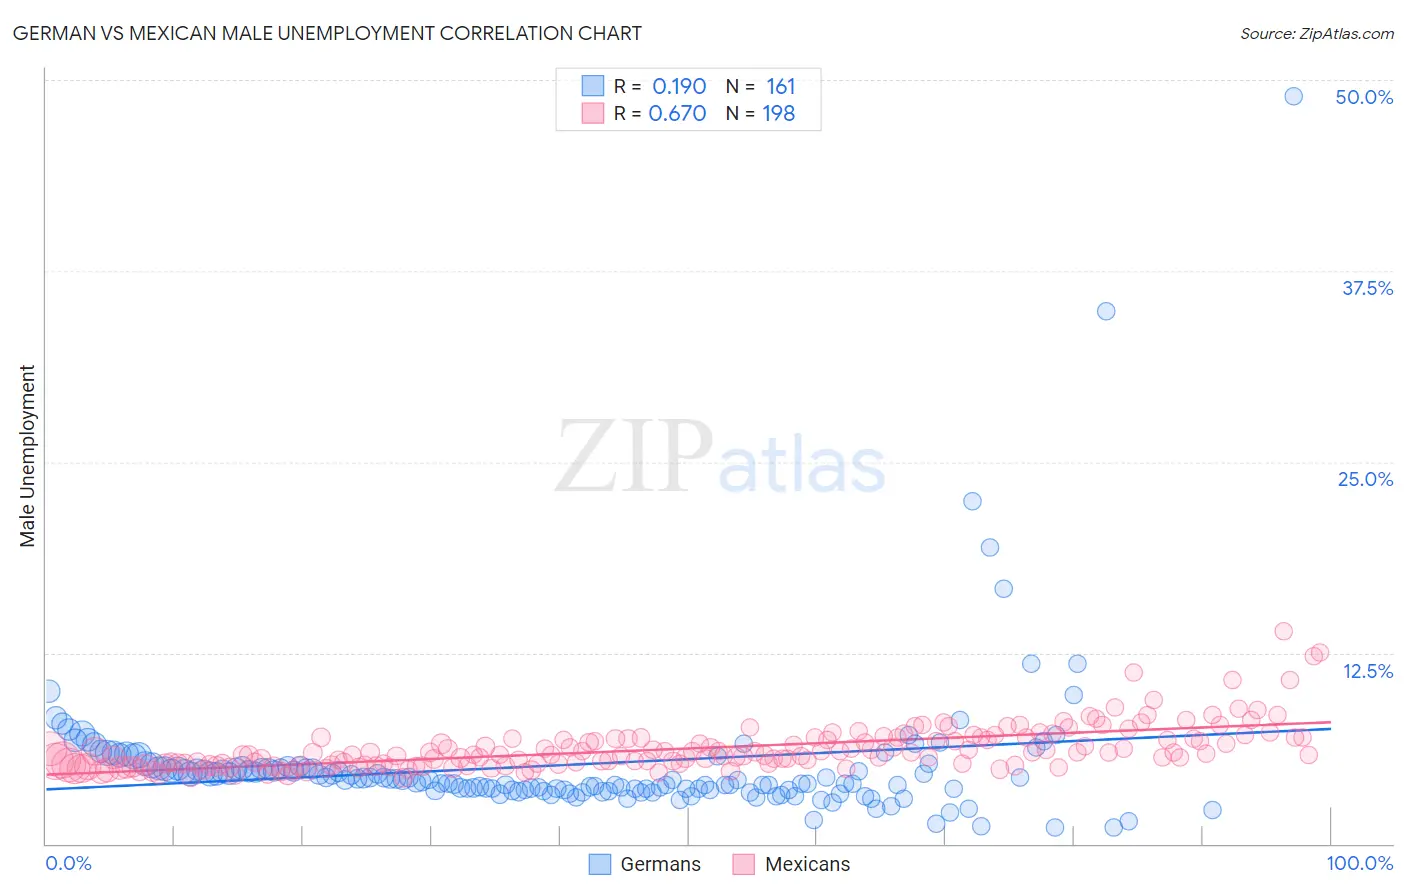
German vs Mexican Male Unemployment Correlation Chart
The statistical analysis conducted on geographies consisting of 567,520,747 people shows a poor positive correlation between the proportion of Germans and unemployment rate among males in the United States with a correlation coefficient (R) of 0.190 and weighted average of 4.7%. Similarly, the statistical analysis conducted on geographies consisting of 555,694,917 people shows a significant positive correlation between the proportion of Mexicans and unemployment rate among males in the United States with a correlation coefficient (R) of 0.670 and weighted average of 5.8%, a difference of 22.8%.
Male Unemployment Correlation Summary
| Measurement | German | Mexican |
| Minimum | 1.1% | 4.3% |
| Maximum | 48.9% | 13.9% |
| Range | 47.8% | 9.6% |
| Mean | 5.2% | 6.2% |
| Median | 4.2% | 5.8% |
| Interquartile 25% (IQ1) | 3.5% | 5.2% |
| Interquartile 75% (IQ3) | 4.9% | 6.9% |
| Interquartile Range (IQR) | 1.4% | 1.7% |
| Standard Deviation (Sample) | 5.0% | 1.5% |
| Standard Deviation (Population) | 5.0% | 1.5% |
Similar Demographics by Male Unemployment
Demographics Similar to Germans by Male Unemployment
In terms of male unemployment, the demographic groups most similar to Germans are Bolivian (4.7%, a difference of 0.020%), Scandinavian (4.7%, a difference of 0.27%), Swiss (4.7%, a difference of 0.32%), Immigrants from Bolivia (4.7%, a difference of 0.70%), and Filipino (4.7%, a difference of 1.1%).
| Demographics | Rating | Rank | Male Unemployment |
| Czechs | 100.0 /100 | #7 | Exceptional 4.5% |
| Luxembourgers | 100.0 /100 | #8 | Exceptional 4.5% |
| Thais | 100.0 /100 | #9 | Exceptional 4.6% |
| Cubans | 100.0 /100 | #10 | Exceptional 4.6% |
| Swedes | 100.0 /100 | #11 | Exceptional 4.6% |
| Immigrants | Bolivia | 100.0 /100 | #12 | Exceptional 4.7% |
| Bolivians | 100.0 /100 | #13 | Exceptional 4.7% |
| Germans | 100.0 /100 | #14 | Exceptional 4.7% |
| Scandinavians | 100.0 /100 | #15 | Exceptional 4.7% |
| Swiss | 99.9 /100 | #16 | Exceptional 4.7% |
| Filipinos | 99.9 /100 | #17 | Exceptional 4.7% |
| English | 99.9 /100 | #18 | Exceptional 4.8% |
| Europeans | 99.9 /100 | #19 | Exceptional 4.8% |
| Pennsylvania Germans | 99.9 /100 | #20 | Exceptional 4.8% |
| Immigrants | Taiwan | 99.9 /100 | #21 | Exceptional 4.8% |
Demographics Similar to Mexicans by Male Unemployment
In terms of male unemployment, the demographic groups most similar to Mexicans are Mexican American Indian (5.8%, a difference of 0.13%), Japanese (5.8%, a difference of 0.30%), Kiowa (5.8%, a difference of 0.41%), Comanche (5.8%, a difference of 0.49%), and Spanish American (5.7%, a difference of 0.57%).
| Demographics | Rating | Rank | Male Unemployment |
| Yaqui | 0.7 /100 | #245 | Tragic 5.7% |
| Iroquois | 0.6 /100 | #246 | Tragic 5.7% |
| Hawaiians | 0.6 /100 | #247 | Tragic 5.7% |
| Marshallese | 0.5 /100 | #248 | Tragic 5.7% |
| Cree | 0.4 /100 | #249 | Tragic 5.7% |
| Immigrants | Bahamas | 0.4 /100 | #250 | Tragic 5.7% |
| Spanish Americans | 0.3 /100 | #251 | Tragic 5.7% |
| Mexicans | 0.2 /100 | #252 | Tragic 5.8% |
| Mexican American Indians | 0.2 /100 | #253 | Tragic 5.8% |
| Japanese | 0.2 /100 | #254 | Tragic 5.8% |
| Kiowa | 0.2 /100 | #255 | Tragic 5.8% |
| Comanche | 0.2 /100 | #256 | Tragic 5.8% |
| Hispanics or Latinos | 0.1 /100 | #257 | Tragic 5.8% |
| Dutch West Indians | 0.1 /100 | #258 | Tragic 5.8% |
| Cajuns | 0.1 /100 | #259 | Tragic 5.8% |