Australian vs Mexican Married-couple Households
COMPARE
Australian
Mexican
Married-couple Households
Married-couple Households Comparison
Australians
Mexicans
47.4%
MARRIED-COUPLE HOUSEHOLDS
89.0/ 100
METRIC RATING
125th/ 347
METRIC RANK
47.1%
MARRIED-COUPLE HOUSEHOLDS
83.4/ 100
METRIC RATING
144th/ 347
METRIC RANK
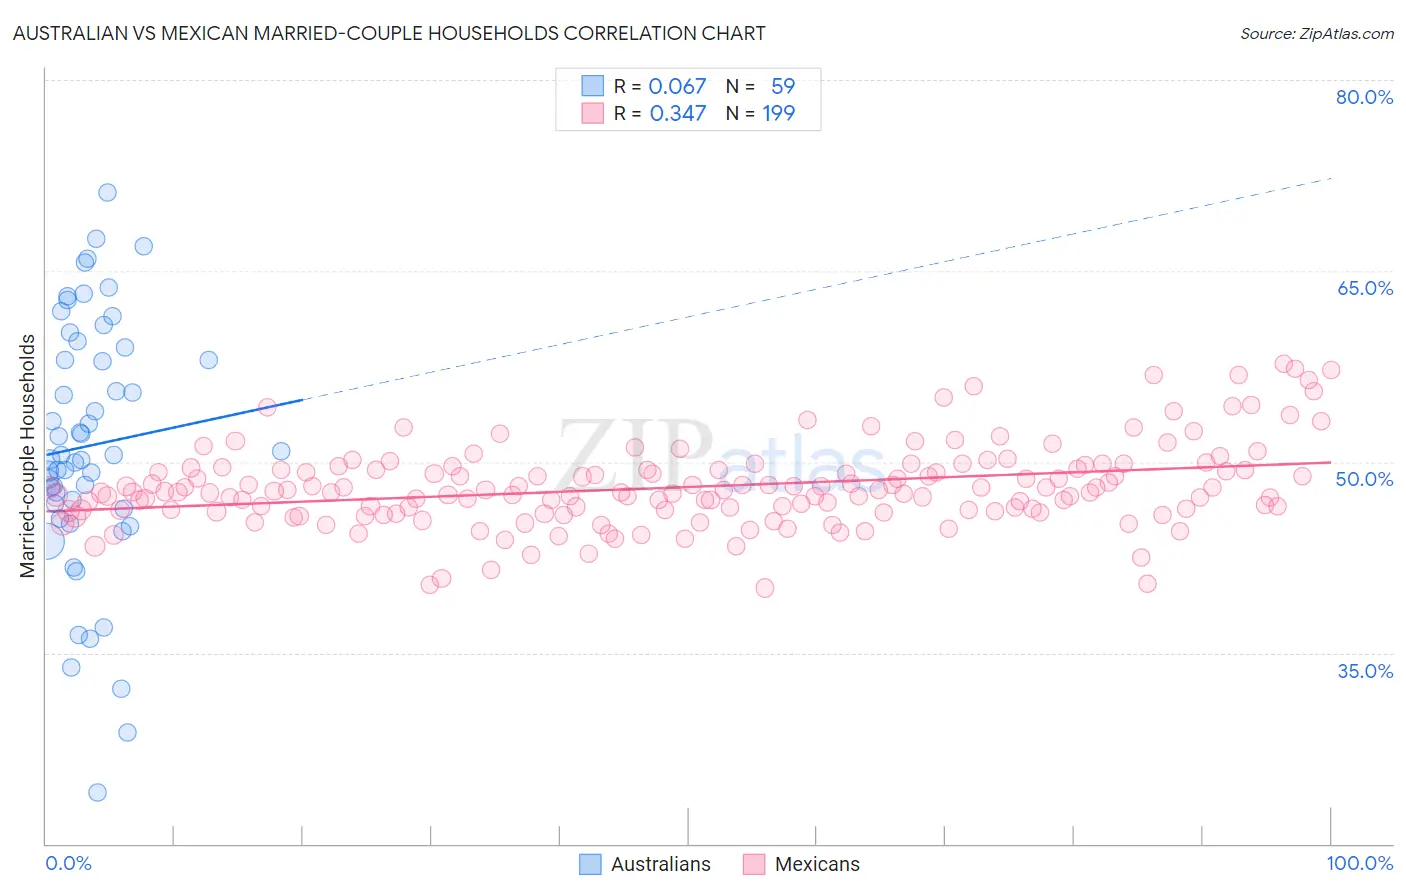
Australian vs Mexican Married-couple Households Correlation Chart
The statistical analysis conducted on geographies consisting of 224,029,086 people shows a slight positive correlation between the proportion of Australians and percentage of married-couple family households in the United States with a correlation coefficient (R) of 0.067 and weighted average of 47.4%. Similarly, the statistical analysis conducted on geographies consisting of 560,704,291 people shows a mild positive correlation between the proportion of Mexicans and percentage of married-couple family households in the United States with a correlation coefficient (R) of 0.347 and weighted average of 47.1%, a difference of 0.44%.
Married-couple Households Correlation Summary
| Measurement | Australian | Mexican |
| Minimum | 24.0% | 40.1% |
| Maximum | 71.2% | 57.7% |
| Range | 47.2% | 17.6% |
| Mean | 51.3% | 48.0% |
| Median | 50.6% | 47.6% |
| Interquartile 25% (IQ1) | 46.3% | 46.2% |
| Interquartile 75% (IQ3) | 59.0% | 49.4% |
| Interquartile Range (IQR) | 12.7% | 3.2% |
| Standard Deviation (Sample) | 9.9% | 3.2% |
| Standard Deviation (Population) | 9.9% | 3.2% |
Demographics Similar to Australians and Mexicans by Married-couple Households
In terms of married-couple households, the demographic groups most similar to Australians are Zimbabwean (47.4%, a difference of 0.020%), Pakistani (47.3%, a difference of 0.030%), Celtic (47.3%, a difference of 0.080%), Immigrants from Peru (47.3%, a difference of 0.10%), and Immigrants from Iraq (47.3%, a difference of 0.11%). Similarly, the demographic groups most similar to Mexicans are Immigrants from Belarus (47.2%, a difference of 0.020%), Spaniard (47.2%, a difference of 0.050%), Spanish (47.2%, a difference of 0.070%), Costa Rican (47.2%, a difference of 0.070%), and Immigrants from Sweden (47.2%, a difference of 0.090%).
| Demographics | Rating | Rank | Married-couple Households |
| Zimbabweans | 89.2 /100 | #124 | Excellent 47.4% |
| Australians | 89.0 /100 | #125 | Excellent 47.4% |
| Pakistanis | 88.6 /100 | #126 | Excellent 47.3% |
| Celtics | 88.1 /100 | #127 | Excellent 47.3% |
| Immigrants | Peru | 87.9 /100 | #128 | Excellent 47.3% |
| Immigrants | Iraq | 87.8 /100 | #129 | Excellent 47.3% |
| Immigrants | Hungary | 87.8 /100 | #130 | Excellent 47.3% |
| Immigrants | Denmark | 87.5 /100 | #131 | Excellent 47.3% |
| Immigrants | Ukraine | 86.7 /100 | #132 | Excellent 47.3% |
| South Africans | 86.4 /100 | #133 | Excellent 47.3% |
| Immigrants | Greece | 86.0 /100 | #134 | Excellent 47.2% |
| Immigrants | Argentina | 86.0 /100 | #135 | Excellent 47.2% |
| New Zealanders | 85.3 /100 | #136 | Excellent 47.2% |
| Immigrants | Malaysia | 85.2 /100 | #137 | Excellent 47.2% |
| Immigrants | Afghanistan | 85.1 /100 | #138 | Excellent 47.2% |
| Immigrants | Sweden | 84.7 /100 | #139 | Excellent 47.2% |
| Spanish | 84.5 /100 | #140 | Excellent 47.2% |
| Costa Ricans | 84.4 /100 | #141 | Excellent 47.2% |
| Spaniards | 84.1 /100 | #142 | Excellent 47.2% |
| Immigrants | Belarus | 83.8 /100 | #143 | Excellent 47.2% |
| Mexicans | 83.4 /100 | #144 | Excellent 47.1% |