French American Indian vs Immigrants from Venezuela Married-couple Households
COMPARE
French American Indian
Immigrants from Venezuela
Married-couple Households
Married-couple Households Comparison
French American Indians
Immigrants from Venezuela
44.1%
MARRIED-COUPLE HOUSEHOLDS
0.4/ 100
METRIC RATING
250th/ 347
METRIC RANK
47.4%
MARRIED-COUPLE HOUSEHOLDS
89.3/ 100
METRIC RATING
123rd/ 347
METRIC RANK
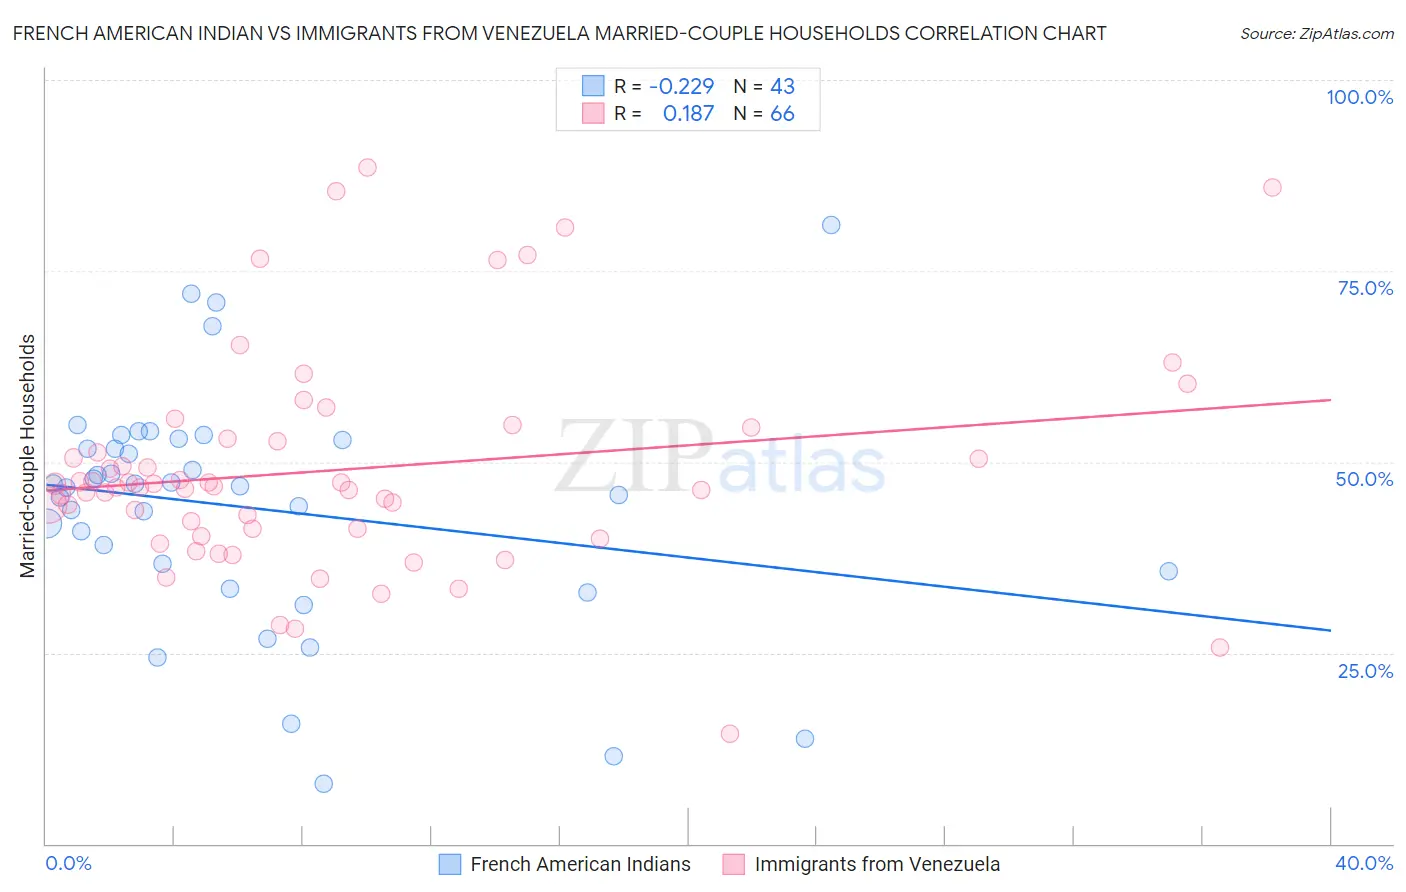
French American Indian vs Immigrants from Venezuela Married-couple Households Correlation Chart
The statistical analysis conducted on geographies consisting of 131,960,385 people shows a weak negative correlation between the proportion of French American Indians and percentage of married-couple family households in the United States with a correlation coefficient (R) of -0.229 and weighted average of 44.1%. Similarly, the statistical analysis conducted on geographies consisting of 287,780,225 people shows a poor positive correlation between the proportion of Immigrants from Venezuela and percentage of married-couple family households in the United States with a correlation coefficient (R) of 0.187 and weighted average of 47.4%, a difference of 7.5%.
Married-couple Households Correlation Summary
| Measurement | French American Indian | Immigrants from Venezuela |
| Minimum | 7.9% | 14.4% |
| Maximum | 81.0% | 88.5% |
| Range | 73.1% | 74.1% |
| Mean | 44.0% | 49.0% |
| Median | 46.8% | 46.8% |
| Interquartile 25% (IQ1) | 35.7% | 41.2% |
| Interquartile 75% (IQ3) | 52.8% | 53.1% |
| Interquartile Range (IQR) | 17.1% | 11.9% |
| Standard Deviation (Sample) | 15.5% | 14.4% |
| Standard Deviation (Population) | 15.3% | 14.2% |
Similar Demographics by Married-couple Households
Demographics Similar to French American Indians by Married-couple Households
In terms of married-couple households, the demographic groups most similar to French American Indians are Immigrants from Kenya (44.1%, a difference of 0.010%), Yup'ik (44.1%, a difference of 0.050%), German Russian (44.0%, a difference of 0.080%), Seminole (44.0%, a difference of 0.15%), and Central American (43.9%, a difference of 0.27%).
| Demographics | Rating | Rank | Married-couple Households |
| Immigrants | Saudi Arabia | 0.9 /100 | #243 | Tragic 44.4% |
| Immigrants | Armenia | 0.7 /100 | #244 | Tragic 44.3% |
| Immigrants | El Salvador | 0.7 /100 | #245 | Tragic 44.3% |
| Immigrants | Cuba | 0.6 /100 | #246 | Tragic 44.2% |
| Immigrants | Morocco | 0.6 /100 | #247 | Tragic 44.2% |
| Yup'ik | 0.4 /100 | #248 | Tragic 44.1% |
| Immigrants | Kenya | 0.4 /100 | #249 | Tragic 44.1% |
| French American Indians | 0.4 /100 | #250 | Tragic 44.1% |
| German Russians | 0.4 /100 | #251 | Tragic 44.0% |
| Seminole | 0.4 /100 | #252 | Tragic 44.0% |
| Central Americans | 0.3 /100 | #253 | Tragic 43.9% |
| Apache | 0.3 /100 | #254 | Tragic 43.9% |
| Shoshone | 0.3 /100 | #255 | Tragic 43.9% |
| Ugandans | 0.3 /100 | #256 | Tragic 43.8% |
| Blackfeet | 0.2 /100 | #257 | Tragic 43.8% |
Demographics Similar to Immigrants from Venezuela by Married-couple Households
In terms of married-couple households, the demographic groups most similar to Immigrants from Venezuela are Zimbabwean (47.4%, a difference of 0.010%), Australian (47.4%, a difference of 0.030%), Pakistani (47.3%, a difference of 0.060%), Okinawan (47.4%, a difference of 0.080%), and Immigrants from Eastern Europe (47.4%, a difference of 0.10%).
| Demographics | Rating | Rank | Married-couple Households |
| Argentineans | 92.5 /100 | #116 | Exceptional 47.5% |
| French Canadians | 92.4 /100 | #117 | Exceptional 47.5% |
| Immigrants | Germany | 92.4 /100 | #118 | Exceptional 47.5% |
| Chileans | 92.2 /100 | #119 | Exceptional 47.5% |
| Puget Sound Salish | 90.5 /100 | #120 | Exceptional 47.4% |
| Immigrants | Eastern Europe | 90.3 /100 | #121 | Exceptional 47.4% |
| Okinawans | 90.1 /100 | #122 | Exceptional 47.4% |
| Immigrants | Venezuela | 89.3 /100 | #123 | Excellent 47.4% |
| Zimbabweans | 89.2 /100 | #124 | Excellent 47.4% |
| Australians | 89.0 /100 | #125 | Excellent 47.4% |
| Pakistanis | 88.6 /100 | #126 | Excellent 47.3% |
| Celtics | 88.1 /100 | #127 | Excellent 47.3% |
| Immigrants | Peru | 87.9 /100 | #128 | Excellent 47.3% |
| Immigrants | Iraq | 87.8 /100 | #129 | Excellent 47.3% |
| Immigrants | Hungary | 87.8 /100 | #130 | Excellent 47.3% |